Siacoin (SC) Has Surged More Than 460% And Ready For Next Move | Theta Coin Price Analysis (Update)

Hey friends hope you are well and welcome to the new update on Sia coin and the Theta coin as well. The Sia coin has formed bullish harmonic patterns in the USD market and the Bitcoin market as well. So in today's post 1st we will discuss about Sia coin then we will also have some update on Theta coin chart that I posted few days back.
Before starting I would like to share my previous ideas of Sia coin that I shared few months back in the US dollar and the Bitcoin markets.
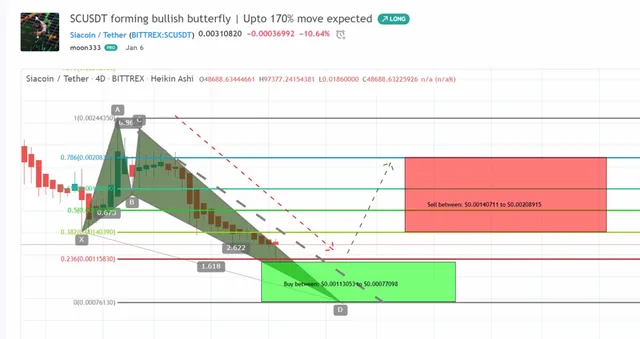
Sia with USD pair previous chart:
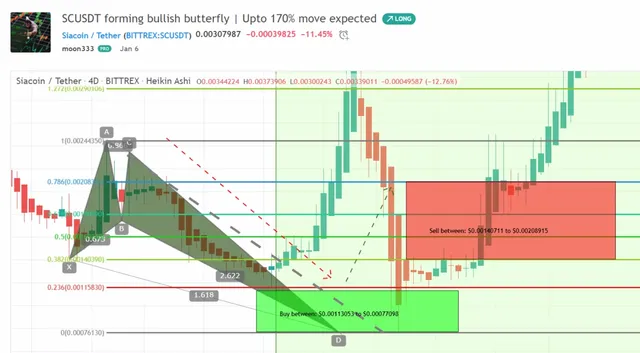
This chart I posted on 6th January 2020. When the Sia coin was just going to complete the final leg of bullish butterfly pattern. Therefore as per Fibonacci sequence of bullish Butterfly I defined the sell targets from0.382 to 0.786 Fibonacci projection of A to D leg. And afterwards the price action just went really very close to the potential reversal zone and reversed to bullish zone and started more than 460% powerful bullish rally.
SCUSD chart before execution:
SCUSD chart after execution:
Click here to visit this old article on tradingview
Sia with Bitcoin pair previous chart:
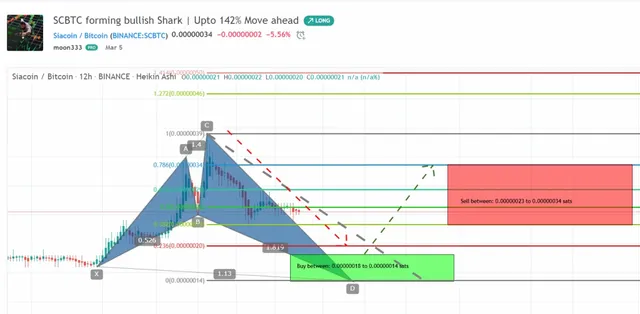
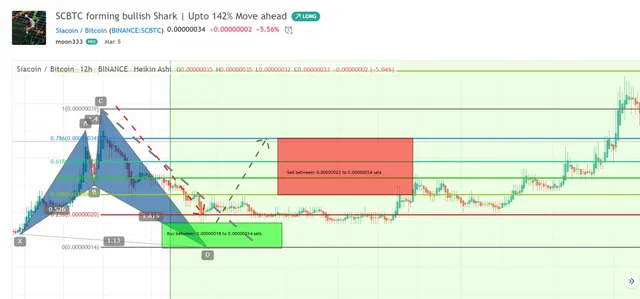
Then I posted Sia with Bitcoin pair chart on 5th March 2020. When on 12 hour chart the Sia coin with Bitcoin pair was completing the final leg of bullish shark. Then finally the price action went in the potential reversal zone of this Shark and after entering it reserved and produced more than 150% bullish rally.
SCBTC chart before execution:
SCBTC chart after execution:
Click here to visit this old article on tradingview
Sia coin to USD current chart:
Now this time Sia coin with US dollar pair is forming a bullish shark pattern. If we take a look at the chat then it can be clearly seen that first price action formed a smaller shark pattern than the current one and now it is completing the final leg of the next shark move. Now as per Fibonacci sequence of shark it should be entered in the potential reversal zone that starts from 0.886 to 1.13 Fibonacci retracement level and the buying and sell targets as per Fibonacci sequence can be as below:
Buy between: $0.002767 to $0.002431
Sell between: $0.003050 to $0.003703
So this trade has the potential to produce up to 51% rally.
Sia to Bitcoin current chart:
Sia coin with Bitcoin pair is also forming a bullish shark pattern on 4 hour chart. If we take a look at the chat then it can be clearly observed that first price action formed a smaller shark pattern than the current one and now it is completing the final leg of the next shark move. Now as per Fibonacci sequence of shark it should be entered in the potential reversal zone that starts from 0.886 to 1.13 Fibonacci retracement level and the buying and sell targets as per Fibonacci sequence can be as below:
Sell between: 0.00000031 to 0.00000027 sats
Sell between: 0.00000034 to 0.00000041 sats
Click here to create free account on tradingview to watch and play the chart on realtime
So this trade also has potential to produce upto 51% rally.
Theta coin:
Few days back I published a post on Theta coin and Theta fuel (TFUEL) token as well. The Tfuel's chart has been executed successfully but the Theta coin's chart is still in process as below:
Theta to USD:
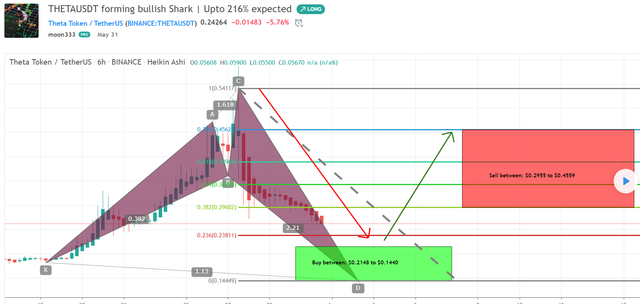
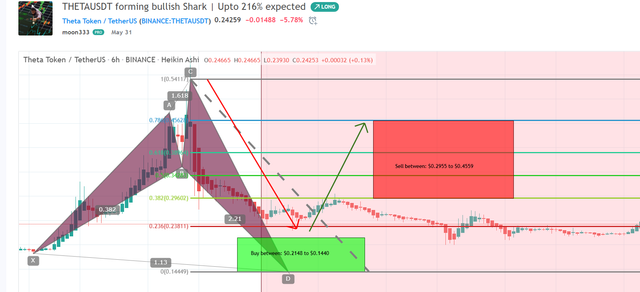
When I published my previous Idea on Theta with USD pair at that time it was completing the last leg of bullish Shark pattern. Now finally this leg has been completed and after entering in the potential reversal zone the price action is gearing up. The targets were as below:
Buy between: $0.2148 to $0.1440
Sell between: $0.2955 to $0.4559
THETAUSD before completion of final leg:
THETAUSD after completion of final leg:
Click here to visit this old article on tradingview
Theta to Bitcoin:
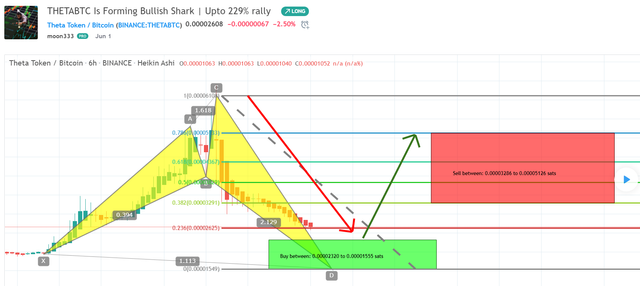
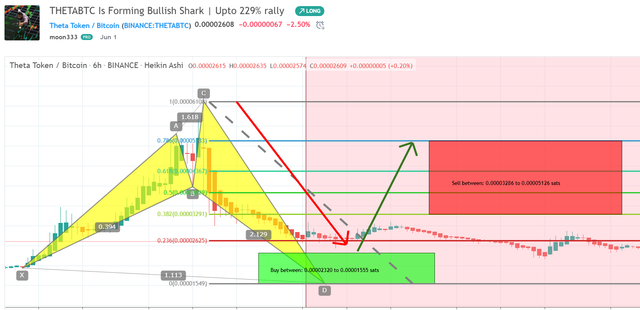
When I published my previous chart on Theta with Bitcoin pair at that time it was completing the final leg of bullish Shark pattern. Now it has completed this leg and after entering in the potential reversal zone the price action is gearing up now. The targets were as below:
Buy between: 0.00002320 to 0.00001555 sats
Sell between: 0.00003286 to 0.00005126 sats
THETABTC before completion of final leg:
THETABTC after completion of final leg:
Click here to visit this old article on tradingview
In all the above trades the maximum extent of the potential reversal zone should be used as a stop loss or if you have your own stop strategy then you can use that strategy as well.
Enjoy your trading and regards.
Note: This idea is education purpose only and not intended to be investment advice, please seek a duly licensed professional and do you own research before any investment.
Shared On DLIKE
