Cryptocurrency price analysis on March 9th: Bitcoin, Ethereum, Polkadot, Ripple, etc.
Data from Glassnode shows that in the past 12 months, Bitcoin (BTC) for centralized transactions has fallen by about 20%. This indicates that investors are withdrawing their bitcoins to cold storage in the hope that they may hold them for a long time. This reduces the available supply, while demand continues to increase.
The arrival of exchange-traded funds may further exacerbate the tight supply situation. After the success of the Bitcoin exchange-traded fund for the Toronto Exchange’s purpose, Canada may launch Galaxy Digital Capital Management (the second Bitcoin ETF under its umbrella. The Bitcoin ETF is approved in Canada and may further impose on US regulators. Pressure requires them to be more lenient in the method of evaluating the BTC ETF proposal.
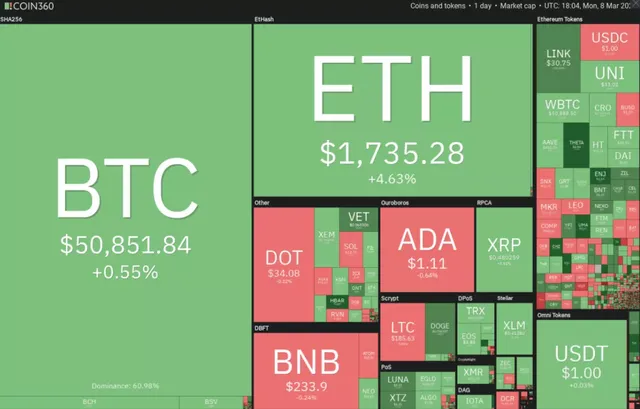 Daily cryptocurrency market performance, source: Coin360
At the same time, companies around the world continue to open their vaults to buy Bitcoin. The latest listed company that plans to buy Bitcoin is the Norwegian investment company Aker ASA, which intends to make the acquisition through a subsidiary called Seetee AS. This shows that the trend has just begun, and several companies around the world can allocate a portion of their reserves to deposit in Bitcoin.
Goldman Sachs has confirmed the launch of its encrypted trading desk, which will support CME Bitcoin futures and non-deliverable forwards (NDF), which are cash settled. Interestingly, an internal survey by the banking giant revealed that 40% of customers already have crypto positions. Respondents to the survey predict that the price of Bitcoin will be between $40,000 and $100,000 by the end of 2021.
Let's study the charts of the top 10 cryptocurrencies to discover key support and resistance levels.
BTC / USD
Bitcoin is currently trading between the 20-day exponential moving average ($48,701) and the overhead resistance of $52,040. Such narrow trading is unlikely to last for a long time.
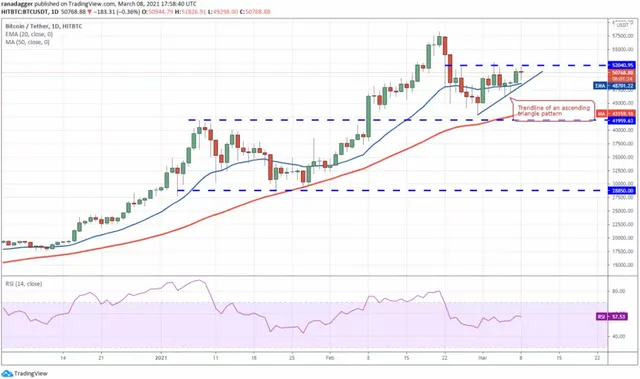 BTC/USDT daily chart, source: TradingView
Although the 20-day EMA is flat, the relative strength index (RSI) has been gradually rising, indicating that the bulls are trying to take control measures.
If the bulls can push and close the price above 52,040 USD, then BTC/USD will complete an ascending triangle formation. This may lead to a retest of the all-time high of $58,341, and then to $61,075, which is a morphological target for a breakout from a triangle.
Conversely, if the price falls from the current level and breaks below the trend line, it may attract short-term momentum traders to profit. Then the currency pair may fall to US$46,313, and if this support level also breaks, the decline may extend to US$41,959.
ETH / USD
Ether (ETH) broke the overhead resistance of $1,670 on March 7, which indicates that the price is strengthening. The 20-day moving average ($1,624) began to rise, and the RSI rose above 57, indicating that the bulls have a smaller advantage.
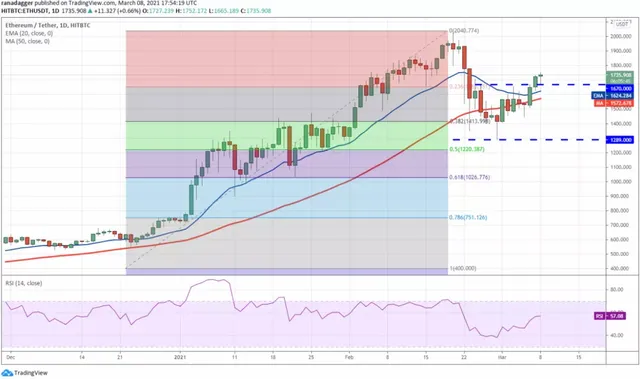 ETH/USDT daily chart, source: TradingView
If the bulls can maintain the price above the moving average, the ETH/USD pair may retest the all-time high of $2,040. Breaking this resistance level may start the next phase of the uptrend.
Contrary to this assumption, if the price falls and breaks below the 50-day simple moving average of US$1572, the currency pair may retest the key support of US$1289.
BNB / USD
Binance Coin (BNB) rebounded from the 20-day moving average ($217) on March 5, but the bulls failed to push the price to the overhead resistance level of $265. This shows that demand is drying up at a higher level.
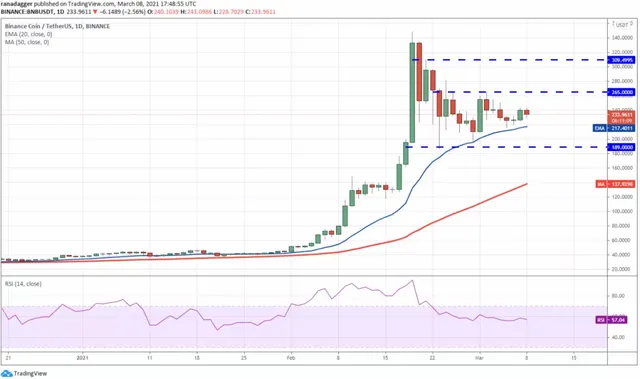 BNB/USDT daily chart, source: TradingView
If the bears make the price fall below the 20-day moving average support level, BNB/USD may fall to $189. A close below the support level may open the door to a break below the 50-day moving average of $137.
Conversely, if the price rebounds from the 20-day moving average, the bulls will try to push the currency pair above $265. If they succeed, they may rebound to $309.49. The rising 20-day EMA and RSI are higher than 57, indicating that the bulls have a smaller advantage.
ADA / USD
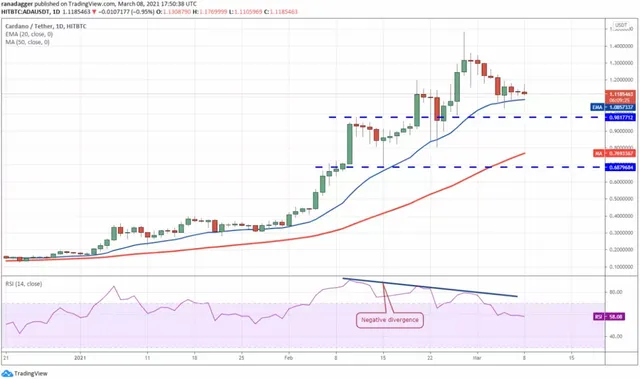
Cardano (ADA) has remained above the 20-day moving average ($1.08) for the past four days, but the failure of the bulls to start a strong rebound indicates the current lack of active buying.
 ADA/USDT daily chart, source: TradingView
The bears may now try to break the support of the 20-day moving average and deepen the correction to $0.9817712, and then to the 50-day moving average of $0.769. However, the flattening 20-day EMA and RSI are both above 58, indicating that the bulls are in a secondary advantage.
If the price can rebound from current levels and rise above $1.20, the ADA/USD pair may rebound to $1.35 and then rise to $1.48.
DOT / USD
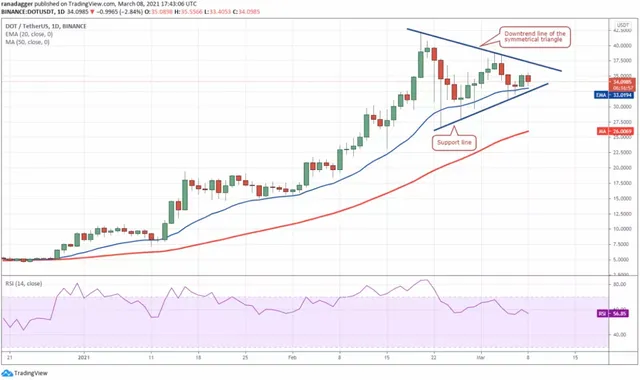
Polkadot (DOT) is currently trading within a symmetrical triangle, which usually acts as a continuation pattern. But in some cases, the symmetrical triangle acts as a reversal pattern, heralding a change in trend.
 DOT/USDT daily chart, source: TradingView
If the bears make the price break below the support line of the triangle, DOT/USD may witness a short-term bull sell-off. The currency pair may then fall to $26.50, with a target price of $17.
Conversely, if the price rebounds from the current level and rises above the triangle, the currency pair may retest the all-time high of $42.28. If it breaks through this level, the price may expand its upward trend and reach the target price of $52.50.
XRP / USD
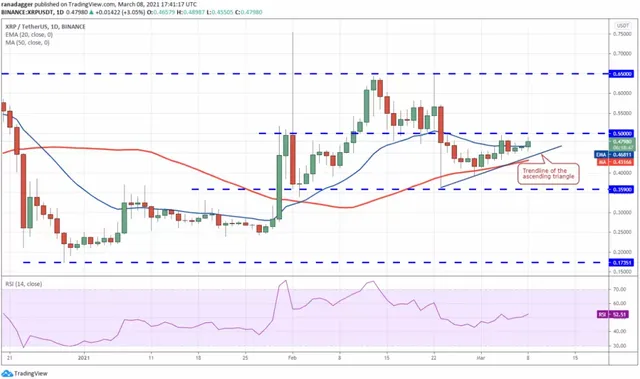
XRP has formed an ascending triangle pattern in a short period of time, which will be completed on the breakout and closed above $0.50. The target price for this bullish setting is $0.635.
 XRP/USDT daily chart, source: TradingView
On the other hand, if the price falls from the current level and breaks below the trend line of the ascending triangle, the XRP/USD pair may fall to $0.359. A break and close below $0.359 will complete a bearish head and shoulders pattern, which may pull the price down to $0.173.
The flat 20-day moving average ($0.46) and RSI slightly above 52 do not indicate a clear advantage for bulls or bears. Therefore, it is best to wait for a decisive breakthrough to occur before making a location call.
UNI / USD
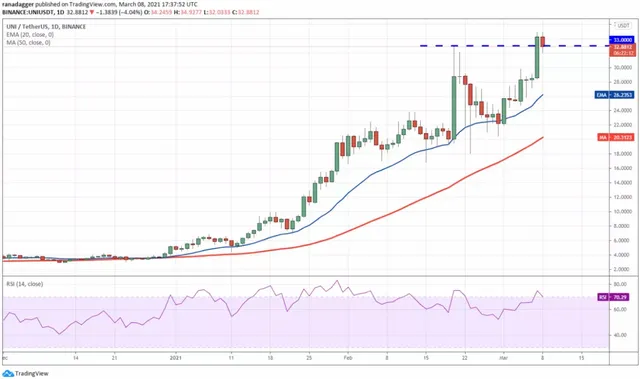
Uniswap (UNI) surged to a record high on March 7, but the bulls failed to build a foundation on this power. The bears are currently trying to bring the price back below the previous resistance level of $33 support.
 UNI/USDT daily chart, source: TradingView
If successful, the UNI/USD currency pair may be corrected to 30 USD, and then corrected to the 20-day EMA (26.23 USD). Both support levels rebounded strongly, suggesting that traders will continue to buy on dips. The bulls will try again to resume the uptrend.
Breaking and closing above $35 may start to rise to $46. The rising moving average and the RSI in the overbought zone indicate that the path of least resistance is to the upside.
If the price falls and breaks below the 20-day moving average support level, this positive view will be invalidated. This may pull the price down to $20.31 at 50.SMA.
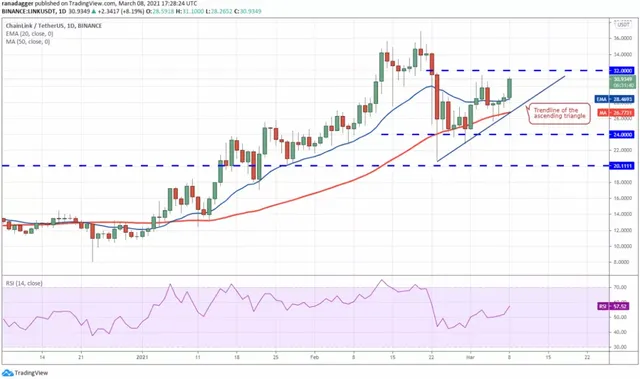
LINK / USD
The current price range of Chainlink (LINK) is $24 to $32. The bulls pushed the price above the 20-day moving average of $28.46 on March 7, clearing the way for a possible rebound to the upper resistance of $32.
 LINK/USDT daily chart, source: TradingView
If the LINK/USD currency pair breaks below and closes above the 32 USD, it will complete an ascending triangle formation. The target price for this bullish setting is $43.191. Although the 20-day EMA is flat, the RSI in the positive zone shows that the bulls have a smaller advantage.
However, if the price drops sharply from $32 and breaks below the triangular trend line, it may extend the stay time within the range. If the price falls and breaks below the $24 support level, this trend may benefit the bears. Such a move may bring the price down to $20.111.
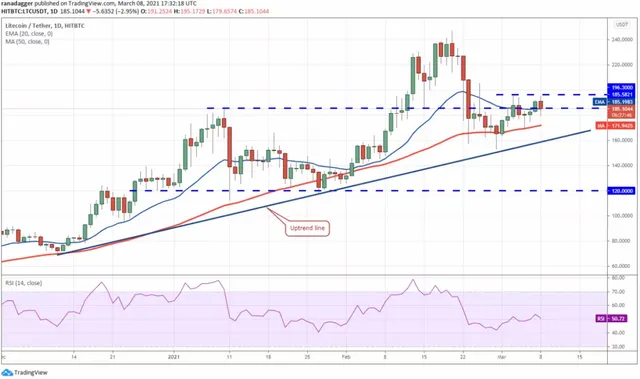
LTC / USD
Litecoin (LTC) is facing strong resistance in the USD 185.58 to USD 196.30 area. Altcoins have retreated from today's upper resistance level and fell below $185.58, which indicates that profit-taking is at a high level.
 LTC/USDT daily chart, source: TradingView
The bears will now try to make the price fall to $171.94 at the 50-day moving average and then to the upward trend line. A break of this support level may start a deeper correction to $152 and then to $120. However, the 20-day moving average ($185) is flattening, and the RSI is close to the midpoint, suggesting that there will be range fluctuations in a few days.
If the price rises from current levels and rises above $196.30, the trend may be beneficial to the bulls. In this case, LTC/USD may rebound to $246.96. Breaking of this resistance level may herald the resumption of the uptrend.
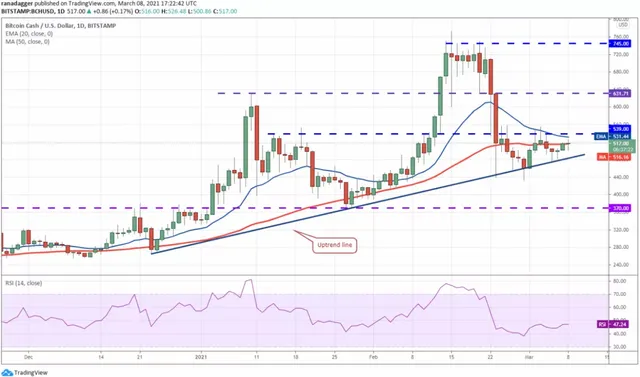
BCH / USD
Bitcoin Cash (BCH) is currently caught between the upward trend line and upward resistance at $539. Today, altcoins have formed a doji candlestick pattern, indicating the indecision of bulls and bears.
 BCH/USD daily chart, source: TradingView
However, the declining 20-day EMA is $531 and the RSI is below 48, which shows that the bears have a smaller advantage. If the seller can drop the price below the ascending trend line, the BCH/USD currency pair may fall to $440 and then to $370.
On the other hand, if the bulls can push and maintain a price above 539 USD, the currency pair may begin its journey towards 631.71 USD.
Keep up the good work!!! Greetings from Argentina!