Contest! || Technical indicators
A wonderful contest which I will love to share my participation in today. Thanks @khursheedanwar for organising such a wonderful contest as this is always my part of speciality in the crypto space.
Technical indicators are tools we use to carry out technical analysis when trading cryptocurrency, stock or even forex. With technical indicators we can be able to determine the trend of the market which involves the movement (uptrend, downtrend or sideways).
So to talk more on the said topic lets look at the contest tips given below. I will discuss extensively on them one after the other. So let's get started without further ado.
| - What importance technical indicators have for making market analysis? |
|---|
The importance of technical indicators for making market analysis are not far fetched. Technical indicators helps to give us many information about the trend and the market situation at any point and time and that is why it is very important to use the technical indicators in our market analysis.
As you may have known, technical indicators gives information about the movement of the assets i.e uptrend movement, downtrend movement or sideways movement. So which ever movement the trade takes the indicator can tell traders the direction.
Knowing the direction of the trend is the first step towards trading your assets because you buy and sell when the market is in certain direction. For traders who trade futures, you place a buy order when the market is moving in an upward direction and if the market continuous as predicted you earn profit.
In thesame way, if the market is going downward or downtrend, you are to sell the asset or place a sell order. If the market continuous going down as predicted then you will make profit. So these are all signals given by the various indicators or the ones we call the trend based indicator.
Also we have other indicators that tells trades when to enter abd when to exit the trade. So signals as such are helps the traders to make informative decision about the market when they apply it to the price chart.
| - Write about any three technical indicators in brief way |
|---|
There are many technical indicators which I use daily but the most recent once that I have also studied and discover their mode of operation are the ones I want to talk about here to enable others also know about it. Please read ahead and see them.
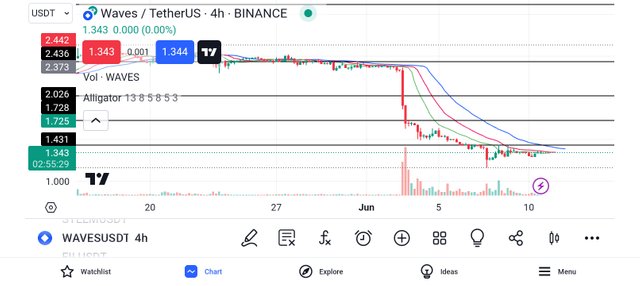
Williams alligator 🐊 indicator: This is a trend based indicator which is use by most traders as it helps traders to know where exactly the market is moving towards.
The Williams alligator 🐊 indicator is made up of three parts namely the jaw, the teeth and the lips. All of these parts are what are taking into consideration when carrying out analysis on the market using this indicator.
If you want to know more about this indicator, I recommend you go through my blog as I have made a comprehensive post with regards to this indicator. If you have any questions also you can drop a comment in the post and I will attend to it ASAP.
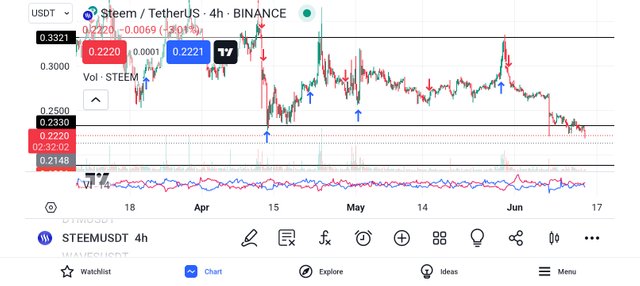
Vortex indicator: Another trend base indicator which I will want to talk about is the Vortex indicator. This is the indicator I discussed about in my recent publications made in the SA community. This is also a trend base indicator which is made up of two oscillator lines.
One of the lines is vortex positive represented with (VI+) and the other is vortex negative represented with (VI-) and also they have a center which is 0. The signal here comes as a result of crossing between the lines. Whenever there is a cross between the both lines you will notice a trend reversal or continuation depending on the market state.
Similarly if you want to have a complete overview about this very important indicator then I will advice you go straight to my blog and read through a more comprehensive details about it.
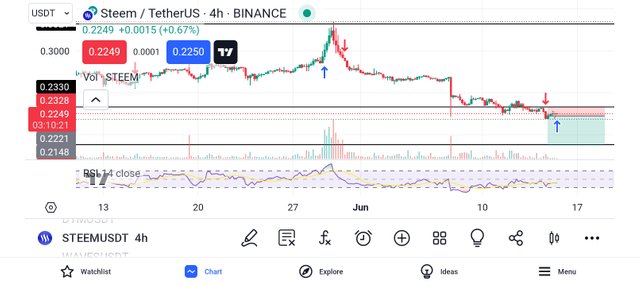
Relative Strength Index (RSI): Another important indicator I use often is the RSI which is the relative Strength Index indicator. This indicator talks tells the trader the information about the market when it is either overbought or oversold.
Since the market doesn't continuously move upward and in the same way it doesn't continuously move downward there is a room for traders to know when to buy and when to sell and this indicator provides them with such signals.
The indicator is made of numbers from 0-100 with 50 as the middle. When the market is found above 70 we say the market is overbought and when the market is found below 30 we say the market is oversold. So when the market is seen within 30-70 we say that the market is neither overbought or oversold.
I want to finally invite @josepha @solaymann and @dave-hanny to join the contest here in this community today and share their opinion as well.


https://x.com/xavierf14044615/status/1801962430311899191?t=_4lTpBRoDMuCHMhBIE-zKg&s=19
Hi dear @simonnwigwe.
Hope you are good. I'm safe and sound too Alhamdulillah by the grace of Allah Almighty. Yes, the technical indicators help the traders to know about the trends in the market. they also helpful to know about the oversold and overbought movements in the market. Best of luck for contest
Regards
@jannat12
Thanks for the comment
Welcome 🤗
Thanks for the support @bossj23