Contest! || Technical indicators
Hi Steemians,
It's another day of the week and I'm delighted to participate in this contest today organized by @khursheedanwar which talks about Technical indicators. I will be making my entry below so read through it and drop your valuable comment as it will be appreciated.
| - What importance technical indicators have for making market analysis? |
|---|
There are many technical indicators used in the market to make analysis and to also know when you are to buy or sell your crypto asset. Some of these technical indicators are trend based whereas others given you a signal to buy or sell your asset.
In all technical indicators are very important when it comes to trading crypto asset as it helps you to know exactly when to enter the market and when the leave the market. One of the most used technical indicators I want to talk about because I use it often is the moving avearage.
Moving avearage is a trend based indicator that tells a trade the current trend of the market at any point and time. As you may have known once you know the trend then it is easy for you to know the what to in the market either to buy or to sell the market.
In summary that is the main function of indicator to every trader. It gives you an idea of when to buy or sell the market and it also tell you the trend of the market at any point and time.
| - Write about any three technical indicators in brief way |
|---|
Here in this section I will be discussing briefly on some technical indicators I'm familiar with and the reason or how they work so let's see them one after the other very briefly.
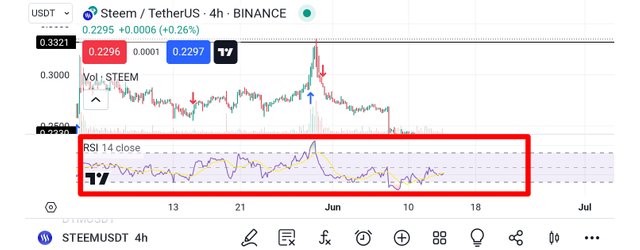
Relative Strength Index (RSI): This is one of the most used indicator in the trading world and these indicator gives signal of over bought and over sold region. This means that the indicator section is divided into two half, the upper band represent overbought region from 70 and above where the lower region from 30 below represent over sold.
When you see this in any market you should always get yourself prepraed for a trend reversal because the market sometimes will reach it elastic limit and will have to return back.
The image above shows the sample of this indicator as added on the chart of STEEMUSDT trade on a 4H tim frame.
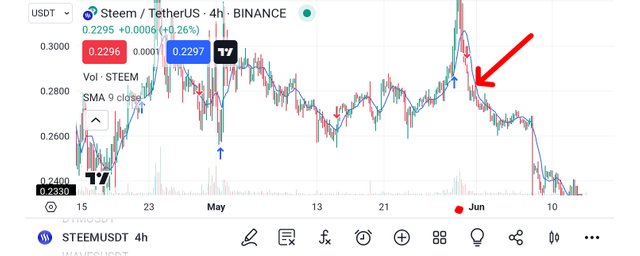
Moving Average (MA): Moving average is another most used indicator that tells us exactly where the trend is going. This indicator is made up of a line and when the line is above the price chart it acts as dynamic resistance thereby making the trader know that the trend is downtrend which is an opportunity to sell.
In the same way if the line is seen below the price chart it represent a dynamic support and that implies that the market will be going up presenting traders with a buy opportunity. So it acts as both a signal and a support and resistance for the market.
The image above shows the sample of this indicator as added on the chart of STEEMUSDT trade on a 4H tim frame.
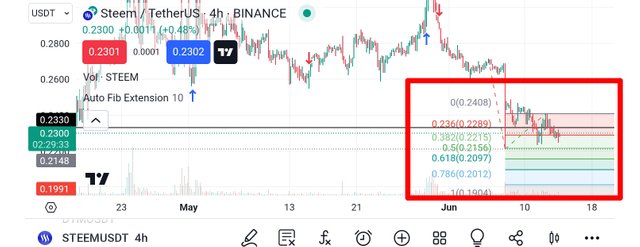
Auto Fibonacci Extension: Another great indicator is the auto Fibonacci Extension tool. This tool helps a trader to know how how far the market is ready to extend or retrace.
With these the trader will know where to set his stop loss and take profit when using such an indicator. So this indicator is important to traders when it comes to know how far the movement of the asset will be.
The image above shows the sample of this indicator as added on the chart of STEEMUSDT trade on a 4H tim frame.
Here I will want to invite a few friends to also join the contest and share their entries as well. I invite @jasminemary, @bonaventure24 and @dave-hanny


https://x.com/kuzboy82334/status/1801490576132509868
This post has been upvoted by @italygame witness curation trail
If you like our work and want to support us, please consider to approve our witness
Come and visit Italy Community
Hi @kuzboy,
my name is @ilnegro and I voted your post using steem-fanbase.com.
Come and visit Italy Community