Understanding Trends II - Crypto Academy / S5W3- Homework Post for @reminiscence01
1. a) Explain your Understanding of Trend Reversal. What is the benefit of identifying reversal patterns in the Market?
As we know, there are generally 2 trends in the market: bullish trend and bearish trend, and the two come in turns. Neither the bullish nor bearish trends last, so along the line, there is a reversal to give way for the opposite trend to happen. This reversal is called trend reversal.
The different trends of the market, whether bullish or bearish is dictated by who is in power or control of the market. When buyers are in control of the market, we see a bullish trend, and a bearish trend when sellers are in control. As a trend progresses, the party in power loses momentum to be able to drive prices in their direction, and get defeated by the opposite party. This is how reversals happen.
A trend reversal can either be a bullish to bearish reversal, in which case a bullish trend turns into a bearish trend or a bearish to bullish reversal, in which case we’re looking at a bearish trend reversing to the upward direction. For a bullish to bearish reversal, the power of bulls weakens and they eventually get defeated by bears who turn the market downwards. Likewise for a bearish to bullish reversal, bears lose control to bulls who drive price up.
1. b) How can a fake reversal signal be avoided in the market? (Screenshot needed).
The patterns we use in predicting price movement are not a 100% accurate and so care needs to be taking in order to avoid making trade decisions based on false signals. As we learned in the lecture, we can several methods such as break of market, break of trendline, double top and double bottom formation, as well as divergences to identify trend reversals. There are cases where we might see this pattern form, but there will be no reversal owing to the fact that this reversal signal of the pattern was simply fake. In this cases, we need not rely on only the patterns, but we need to add in technical indicators to confirm confluence or agreement before making any decision. I will be using the RSI indicator in the chart below to explain this.
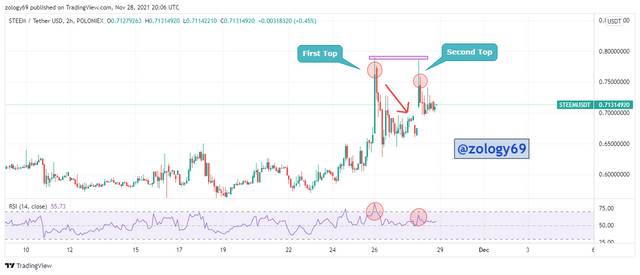
As we know, the RSI uses 70 and 30 regions to show whether an asset is overbought or not. An asset that is overbought is expected to reverse downward and an asset that is oversold is expected to reverse upward. In the screenshot above, we see the double top structure form on the STEEMUSDT chart, signaling a reversal. However, this reversal is not valid. Let me explain. We can see that after the formation of the first top of the structure, RSI broke above 70 showing STEEM was overbought and indeed, STEEM reversed in a retracement downward. However after the formation of the formation of the second top, RSI doesn’t show oversold, which suggests that there will no trend reversal.
2. Give a detailed explanation on the following Trend reversal identification and back up your explanation using the original chart. Do this for both bullish and bearish trends (Screenshots required).
a) Break of market structure
We discussed how market structure can be used as trend continuation indicator. With this knowledge, we can say a breach or break of either a bullish or bearish market structure indicates the market is prepping for a potential reversal.
For a bullish trend, the market structure shows price making higher highs and higher lows. This simply means the price must make highs higher than the previous high and lows also higher than the previous low. This will indicate that bulls still are in control and driving the market up. A failure to make new highs is a break of bullish market structure and will indicate the power of bulls is weakening and that bears are starting to take control of the market. Let’s take a look at a break of market structure in the bullish trend below, building to a bullish to bearish reversal.
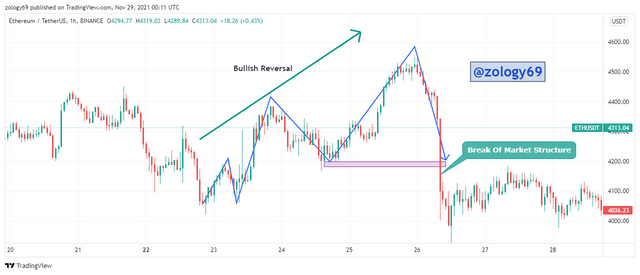
In the 1-hour ETHUSDT chart above, price is unable to make a higher low. Also, the last low point of the structure extends past where the arrow ends, which is the previous low point. In a bullish market structure, the new low can not be lower than the previous low. As such, the continuation pattern is broken and a trend reversal to the downside happens.
For a bearish trend, the market structure shows price making lower highs and lower lows. Price must make highs lower than the previous higher and lows lower than the previous low. This is an indication that bears are in control of the market and driving price lower and lower. A failure to make lower highs and lower lows is a break of bearish market structure and indicates bear are losing control of the market to bulls. Let’s take a look at a break of bearish market structure below leading to a bearish to bullish reversal.
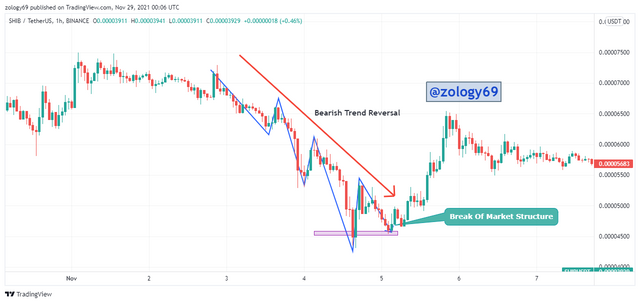
Price is unable to make lower lows in the 1-hour SHIBUSDT chart above. The bearish market structure is broken when price makes a higher low than the previous low. This indicates bulls are taking control of the market and there will be a reversal to the upside.
b) Break of Trendline
Again in our previous lectures, we learned how we can use trendlines to identify trend continuation. As we have 2 trends, we also have 2 trends. A bullish trendline is drawn below price movement connecting two low points acting as support. For a bearish trendline, the trendline is drawn above price movement, connecting 2 high points acting as resistance. Price bounces of these trendlines, but when it breaks either the support of the the bullish trendline or resistance of the bearish trend line, a reversal to the other direction is imminent. Let’s take a look at some trend reversal due to a break in trendline below.
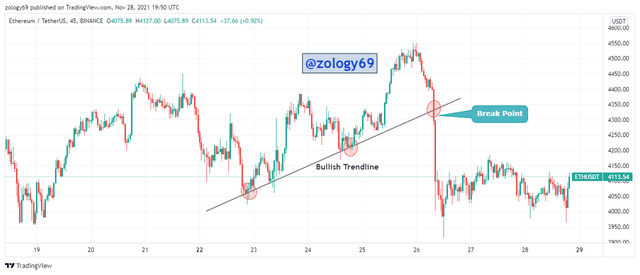
Price breaks the bullish trendline in the 45-minute ETHUSDT chart above, looking to reverse in the opposite direction. The bullish trendline is a dynamic support below price movement, which price bounces off of, and going below this line suggests a possible trend reversal to the downside. The chart above is bullish to bearish reversal.
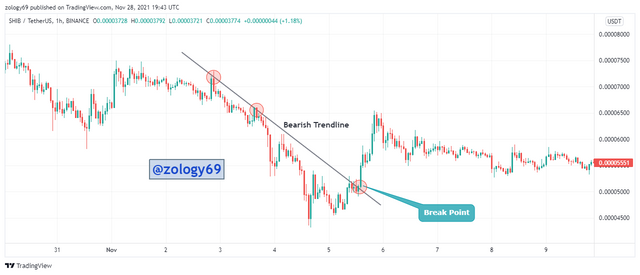
In the 1-hour SHIBUSDT chart above, price breaks the bearish trendline, making its way up. The bearish trendline is drawn as a dynamic resistance above price movement, which price bounces off of, and crossing it suggests the coming of an imminent trend reversal. The chart above is a bearish to bullish reversal.
c) Divergence
A divergence simply can be understood as disagreement or lack of confluence between price movement and technical indicators. When a divergence occurs, price and technical indicator move in opposite directions, contradicting each other. For example, price might make higher highs indicating a bullish movement, and despite this fact, a technical indicator might make lower lows suggesting otherwise. There are two types of divergences: a bullish divergence and a bearish divergence.
Bullish Divergence
During a bullish divergence, price makes lower lows while our technical indicator contradicts price movement making higher highs which indicates that selling pressure is weakening and there is building buying pressure as bulls attempt to take control over the market. This signals traders of a possible reversal to the upside early enough for them to enter buy positions to buy assets for cheaper and sell in profit when the reversal happens.
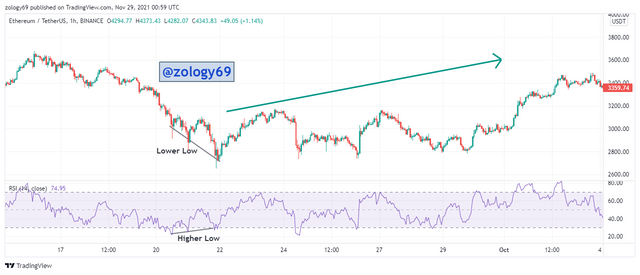
In the 4-hour XRPUSDT chart above, we see disagreement between price movement and RSI, as the RSI makes higher lows while price makes lower lows. This indicates a lack of confluence, which suggests there is an imminent trend reversal to the upside. We actually observe this happen, a while after the divergence occurs.
Bearish Divergence
Here, price is seen moving in an uptrend making higher highs and higher lows, but our indicator makes lower lows indicating that buying pressure is weaking and selling pressure is building as bears attempt to take control of the market. This implies there is an imminent trend reversal to the downside and traders use this signal to exit in profit before the downtrend begins, and prepare strategies to take advantage of the downtrend.
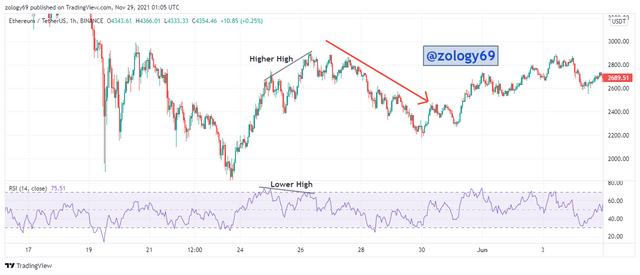
In the 1-hour ETHUSDT chart above, there is disagreement between price movement and the RSI, as RSI makes lower highs while price makes higher this. This indicates weakening buying pressure and building selling pressure suggesting bears are taking over the market and a bullish to bearish reversal is imminent.
d) Double Top and Double Bottom
Market structure teaches us that price needs to make higher highs for a bullish trend continuation to be valid, and lower lows for a bearish trend continuation to valid. When double top and double bottoms form, price is unable to create new highs or lows. Double top and double bottom conformations form as a result of price making a first new high or low, and making attempts to reach it again but fails.
Double Top
Double Top structures occur in trends. In a double top structure, price makes a higher and after a retracement, attempts to make a new high higher than the previous high but fails. This breaks the market structure for a bullish trend, and is a major signal of an imminent reversal to the downside. A double top signals buyers are unable to build up enough buying pressure, and are losing momentum to sellers. It as a strong bullish to bearish reversal signals and allows traders short their assets in profit before the reversal to the downside happens.
Price must not break above the previous high point as this will imply that there is a bullish trend continuation, and invalidates the double top structure. Also, the closing price of the second top must not be higher than the high point of the first top for the double top structure to be valid.
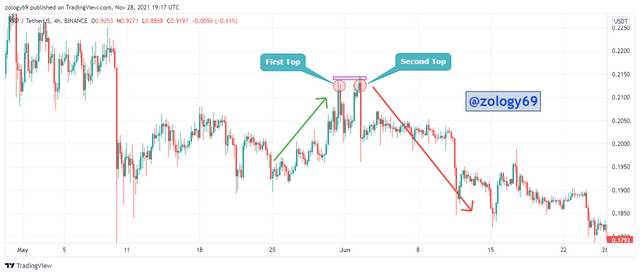
In the 4-hour XRPUSDT chart above, we see a double top structure form. This forms when price creates a first top, and in an attempt to reach or break the high of this top a second top is created, which is unable to break the previous top. It is a strong bullish to bearish reversal signal as bulls are unable to push price higher because there is not enough buying pressure.
Double Bottom
In a Double Bottom, a market structure of a bearish trend is broken as price a lower low and in an attempt to break it, fails. This indicates that bears are losing control of the market to bulls as they aren’t able to build enough selling pressure to keep pushing price to make new lower lows. It is a strong bearish to bullish trend reversals, allowing traders to enter long positions cheap and sells when the anticipated reversal to the upside comes
Price must not break below the previous low point as this will imply that there is a bearish trend continuation, and invalidates the double bottom structure. Also, the closing price of the second bottom must not be lower than the low point of the first bottom for the double top structure to be valid.
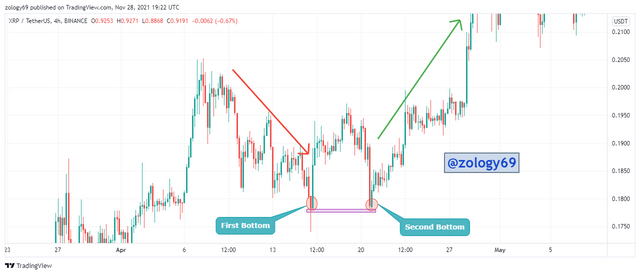
In the XRPUSDT chart above, price movement creates a first low bottom, and attempts to create a lower bottom, but fails to do so, producing a second bottom not as low as the first bottom. This means that bears are unable to build enough selling pressure to keep pushing price down and a reversal is going to happen.
3. place a demo trade using any crypto trading platform and enter a buy or sell position using any of the above mentioned trend reversal/continuation pattern
Demo Trade Using Trendline Break
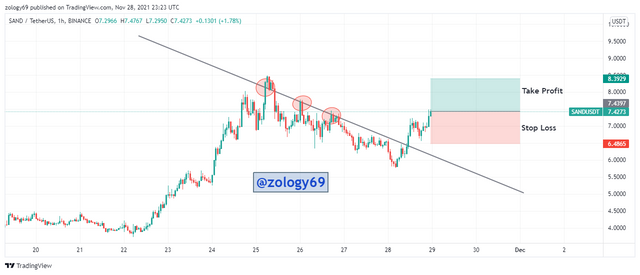
From the 1-hour SANDUSDT chart above, we see that the trend line structure is broken and a trend reversal has been spotted while it is still early. Price was unable to make lower lows and made a higher instead, suggesting that bulls are taking over the market, hence a bearish to bullish reversal has happened.
After sporting the trendline break signaling a bearish to bullish reversal, I enter a long position with stop loss at 6.4867 just a little below a support level that just got broken. I set my take profit at 8.3929 to be in a 1:1 R:R with my stop loss. Below is my proof of transaction.
.png)
Conclusion
As important as it is to learn to identify trend continuation patterns, it is equally important to learn to identify trend reversal patterns. It is actually quite easy because we know that once a continuation pattern is invalidated, it results in a reversal. We can identify trend reversals in the following ways: market structure break, trendline break, divergence, double top and double bottom structures.
Cc: prof @reminiscence01
Hello @zology69 , I’m glad you participated in the 3rd week Season 5 of the Beginner’s class at the Steemit Crypto Academy. Your grades in this task are as follows:
Observations:
That's correct. These conditions are required to identify and predict the direction of the market.
Recommendation / Feedback:
Keep this energy up in the academy. Thank you for participating in this homework task.
Thank you for the review prof. I will do better to score more next time.