Crypto Academy Week 16 - Homework Post for @kouba01
I had a really good lecture on Bollinger Bands this week and I am presenting my homework after further research I did on the interesting topic.

Define the Bollinger Bands indicator by explaining its calculation method, how does it work? and what is the best Bollinger Band setup?
Bollinger bands developed by John Bollinger are one the technical analysis tools like the Wyckoff Method used in the stock market and in our current day today, it is implemented in our crypto trading environment. The name implies they’re bands but what do these bands do you might ask. They are price channels that represent a volatility range on a chart.
The Bollinger Band works as three bands, drawn to move with price. We draw a 20-day moving average in the middle with an upper band and a lower band 2 standard deviations above and below the moving average respectively. The upper and lower boundaries can act as resistance and support levels because some traders use it as a guide in that they avoid buying when prices hit the upper Bollinger band and don’t sell when prices reach the lower Bollinger band. The occurrence of a resistance, support or trend in the chart established by the upper and lower bands are predicted using the standard deviation which expresses how much the bands deviate from the moving average. The behavior of the bands whether widened or close to each other depend on the how volatile the market is. Close bands(contractions) signals a low volatile market while wide bands signifies increased market volatility
Bollinger Band Calculation Method
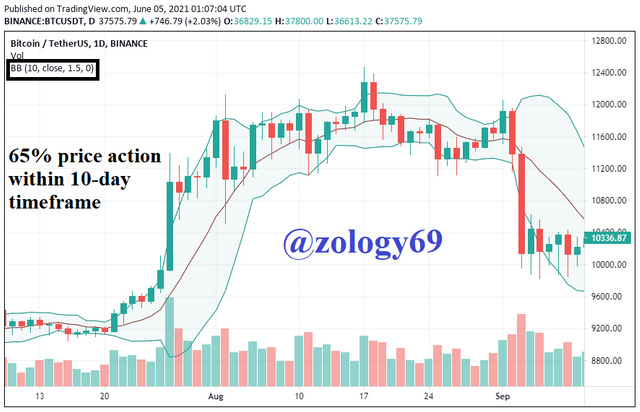
To draw our bands, we first of all need to calculate the moving average. The advised moving average is a 20-day moving average with a standard deviation of 2. A standard deviation of 1 has 65% of price action. We have a high 95% of price action within a standard deviation of 2 of the Bollinger bands and a whooping price action of 99% for a 3 standard deviation. We can have other standard deviations of 1.5 and 2.5 as well with moving averages of 10 and 50 days respectively.
The moving average can be calculated using the formula:
Moving Average = Sum of prices over x days/number of days
With our 20-day moving average, we can calculate our Bollinger bands by adding 2 standard deviation to the upper band and substracting 2 standard deviations from the lower band.
Best Bollinger Band Setup
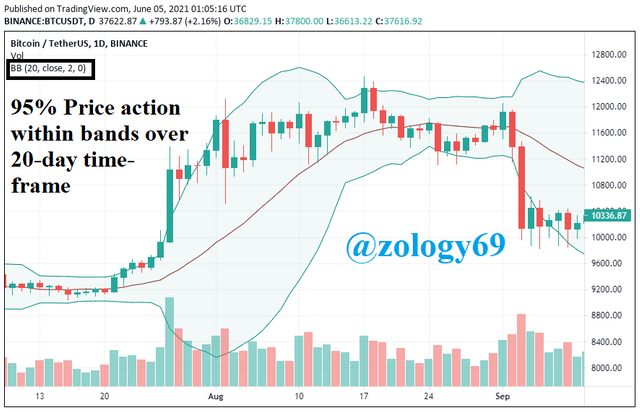
The best Bollinger band setup is the (20, 2) setup which has a 20-day moving and a standard deviation of 2. You might ask why I say this. This is because statistically, prices should often stay within the bands with this setting as we can see in the chart in the screenshot below. I am using BTC|USDT for all my analysis in this assignment
.png)
What is a breakout and how do you determine it?
From a general sense of understanding, breakout is understood as getting out of control. In a technical way breakout is a drastic increase or decrease in price as a result of market volatility changes. During a breakout, prices move outside the Bollinger Bands. Using a Bollinger Band Squeeze Strategy, a breakout is normally expected after a squeeze. A squeeze just as the name implies is the narrowing of the upper and lower Bollinger Bands hence trading range indicating decreasing volatility.
There is drastic price changes during breakouts. There are significant price changes in either direction causing uptrends or downtrends. Hence traders use breakouts as trading opportunities hoping the breakout moves upward in an uptrend.
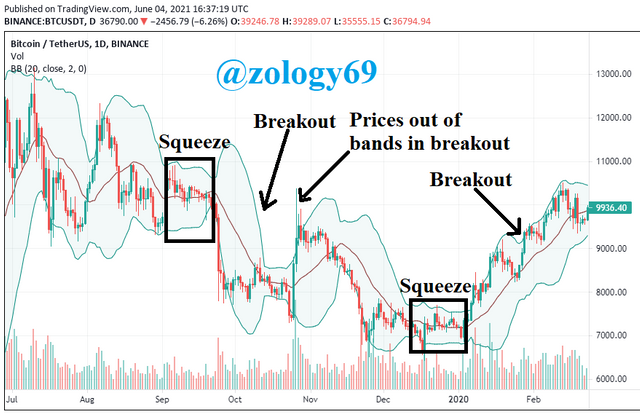
In my screenshot above I am using BTC|USDT for my analysis. We can see that there is a significant uptrend therefore increase in price following the Bollinger Bands narrowing indicating a decreasing volatility in the market. The narrowing of the Bollinger band should’ve signaled investors of a breakout which is really observed in the chart above.
Just like the narrowing of Bollinger bands can cause an uptrend breakout, a downtrend can also occur during the breakout as it is not guaranteed that every breakout will always cause an uptrend. The breakout normally moves in the direction of the candle stick pushing against the band. The potential move is stronger the more vertical the candlestick. This is explained in the screenshot below
How to use Bollinger bands with a trending market?
Trending markets can be in two forms. Markets that are characterized by uptrends and those characterized by downtrends. We should observe trending markets for narrowing movements of the Bollinger bands which will signal low volatility and a possible breakout. It is almost guaranteed that there will be uptrend or downtrend soon when narrow bands are observed.
The goal of all traders in the market is to make profits by buying low and selling high. The issue is how low should prices go before you buy and how high should prices go before we sell. The Bollinger bands information on this and other things to consider in trending markets to maximize profits.
We can use the Bollinger bands to determine if something is over bought or oversold. Over 95% of the price action of bands normally remains within the bands. Hence if for example the market ever went beyond the lower Bollinger band, it would signal that prices are cheap and that it is a good time to buy. Prices that move outside the bands are due to be corrected soon and so we should buy or sell in the shortest possible time.
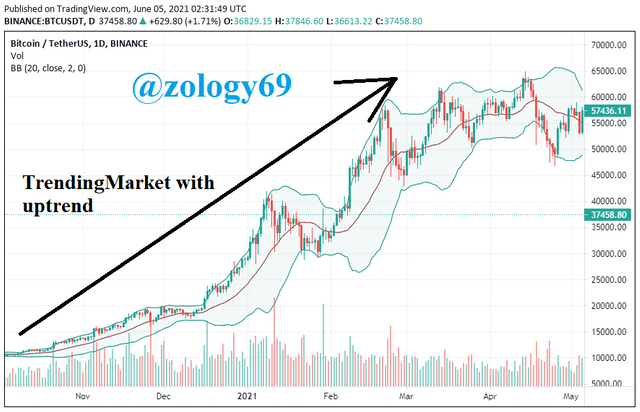
We can see that between April and May, it was a good time to buy as prices went below the lower band indicating an oversold market. Overbought markets can also be noticed though not significant enough.
What is the best indicator to use with Bollinger Bands to make your trade more meaningful?
To help make better inferences and deduction from the Bollinger Bands, several indicators that work with it can be used. The best indicator to work the Bollinger bands for me is the BandWidth indicator.
Let’s first understand what bandwidth is before we jump to how to works with the Bollinger bands to guide trade. Bandwidth is the width of bands in relation to the middle band. It is used to spot Bollinger Squeeze which I mentioned earlier in my presentation. This indicator signals traders of a volatility decrease in the market, implying a price breakout. Some traders will also consider this a signal that volatility is about to increase with the breakout. This signal can be used in combination with signals from the Money Flow Index(MFI) indicator for example to be able to anticipate the impeding breakout direction. Once a Squueze is identified, you can anticipate a major change in price of asset(breakout) soon and can hence prepare to make huge profits or brace for loss.
To calculate Bollinger Squeeze, we use the formula:
Upper Band(20 periods)-Lower Band(20 periods)/Middle Bands(20 periods)
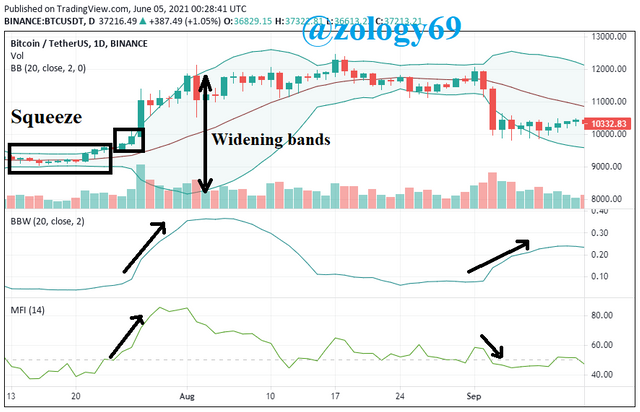
From my screenshot above, we can observe a squeeze between 13th to 20th August indicating a volatility decrease in the market. You can see that the Bollinger Band Bandwidth increases after 20th July as the upper and lower bands widen indicating increasing market volatility.
Around July ending As we observe the Bollinger Band Bandwidth rising with the widening upper and lower bands, we also see that the Money Flow Index(MFI) moves upward above the straight line indicating a bullish trend and we actually do see that in the screenshot. We also can see the green candle sticks touching the upper band also suggesting that the direction of the breakout is possibly an uptrend.
Around the beginning of September also we see another Squeeze also signaling another breakout. However we see the red candle stick pushing against the lower band. The Bollinger Band Bandwidth is also increasing showing widening of lower and upper bands and suggesting a possibe breakout but in what direction. We also see that the MFI appears to be moving under the straight line suggesting a bearish trend like we really observe.
What timeframe does the Bollinger Bands work best on?And why?
The timeframe that the Bollinger band works best on is dependent on the target of the investor, what the investor is particularly interested in about the asset.
The 20-day moving average is considered the ideal time frame by even John Bollinger and has a default of 2 standard deviation by default and contains about 95% of price action.
Using a lower timeframe of say 10 days will have a 1.5 standard deviation. About 65% of price action is contained within a standard deviation of 1. Lowering the standard deviation will cause the bands leaving the candles often. It will generate more signals, generating more false signals as well.
Using a higher time frame of say 50 days will have a 2.5 standard deviation. About 99% of price action is contained within a standard deviation of 3. Increasing standard deviation to 3 will show that prices rarely leave the band. Using a higher standard deviation of 2.5 or 3 will generate fewer but more reliable signals.
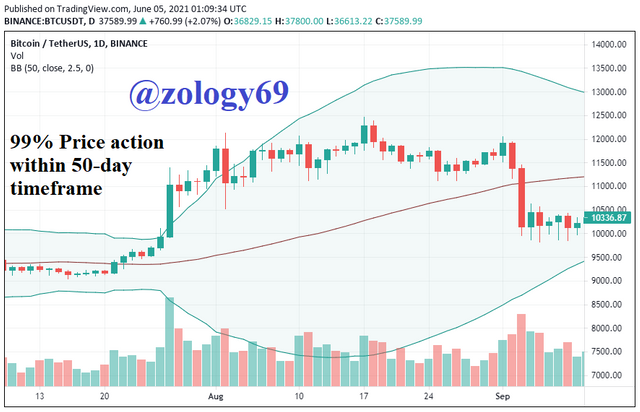
Hence for an investor interested solely in price action, your best timeframe would be the 50day moving average with a 2.5 standard deviation as this will ensure that prices will almost always stay within the bands.
Review the chart of any pair and present the various signals giving by the indicator Bollinger Bands
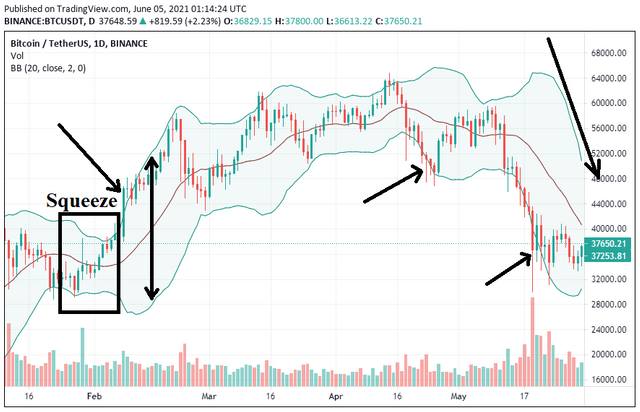
Using the Bollinger Bands, we see that there was a Squeeze in the beginning of February. This indicated a volatility decrease in the market and an impeding breakout. Seeing as the candle sticks with higher vertical length touches the upper band, we can expect a bullish trend. We observe an increase in volatility during the uptrend where bands widen once more. We also observe overbought market around March 16th and April 16th (not very significant). Between April 16th and May, we observe some oversold markets also following a bearish trend. In the days near 17th May, we observe more oversold markets and a trend reversal
The Bollinger band is a good technical analysis tool to use to observe market trends as well to be informed about good dip points to buy and when to sell for maximum profit. To make even better trade decisions, we can use the Bollinger Bands with other indicators like the Bollinger Band Bandwidth and the Money Flow Index that work with the Bollinger bands to make great inference and predict market movement. Now I have some means to do market analysis myself. I hope the courses in the future are as helpful as this one.
This lecture by professor @kouba really is a wonderful lecture and I hope my presentation covers everything required.
Hi @zology69
Thanks for participating in the Steemit Crypto Academy
Feedback
Generally acceptable content that lacks an in-depth analysis and explanation of the Bollinger bands trading tool.
Homework task
6
Thank you for the review. I’m embarassed I didn’t impress you. I’ll work harder on my analysis in my next assignment.