Crypto Academy Week 16 - Homework Post for @fendit

The Wyckoff method of Richard Demille Wyckoff, one of the five technical analysis titans over a century ago serves as a trend analysis guide or strategy for traders to help them maximize profits in trades and is currently used as a guide by crypto traders in the stock market.
His work led to the dawn of some very helpful theories and trading techniques that have surpassed his time in this current technologically advanced world.
The composite man theory helps us make observations and take strategic steps to follow some trends or phases in the stock market to cut loss and maximize profits.
The fundamental Laws help us observe and predict price direction and teaches us why prices are behaving the way they are by examining effect caused by specific events in the market. It also teaches us to look out for correlations between asset price and volume to tell if trends could potentially change or stay in course.
Share your understanding on "Composite Man" and the fundamental laws. What's your point of view on them?
To the layman, the composite man is probably a man like the word suggests. In the cryptocurrency world though, the composite man is a projection or representation of the market. His behavior gives us trends that we can study and observe to make assessment on how to behave in the market and to be able to predict prices of assets based on trends.
The composite man is an imaginary moderator of the stock market. Trying to think like and follow a lot of people in the stock market to observe trends and make evaluations will be considered a hectic task. However if we were to box everyone into one person called the composite man, observing his trends and predicting his next move will be a lot easier. Using the imaginary image of the composite man, we can study fluctuations in price as if they were the result of one person’s operation.
He represents the big investors who have great influence in the stock market that try to bend the stock market to their will to maximize their own profits at the expense of small investors who lack the know on how to use this strategy.
While most people see this as a somewhat of a selfish move, I think it’s a good one where if people can learn to study the composite man and his behavior, follow and learn the trends they could potentially make good profits like the big investors. If we can identify the behavior and phases of the composite man, we can spot investment opportunities early enough to profit from them. We (small investors) will just have to be attentive of the phases of the composite man to invest at the right time and make our exit when the ship is sinking.
To attract people to buy a stock he holds in large quantities, he indulges in many trades involving huge numbers of his stock to create the illusion of a broad market for the stock.
From Wyckoff’s studies, some characteristics of the composite man are:
- The composite man plans and execute plans to control market movement.
- The composite man creates the illusion of a broad market for assets he has accumulated to attract people and investors to buy it in large stocks.
The composite man’s behavior illustrated in phases of the market cycle
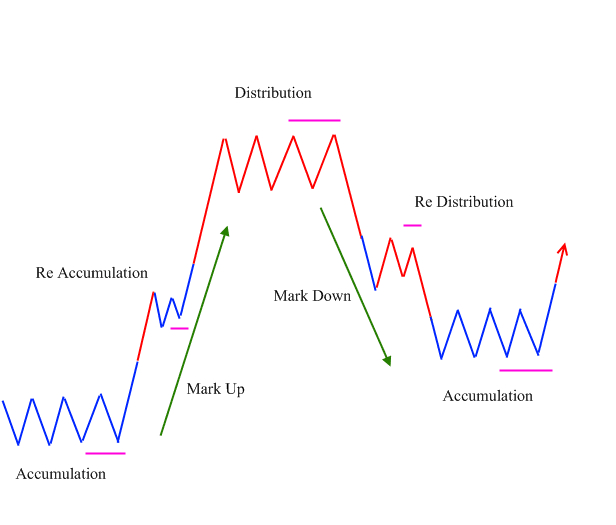
• Accumulation: At this phase price variation is not very significant and stays within a small range. The attention of other investors on the particular asset is weak and for the composite man, the accumulation phase is when he enters into stock, buying in volumes that wouldn’t draw attention at the time while other investors are not aware. He accumulates as much assert as he can in an unnoticeable way that will spike the market.
• Uptrend: After the composite man has accumulated enough assets and asset seems scarce, the He raises the market causing an uptrend. Naturally, other investors and the general public will buy into the assert because of the prize raise. This will cause a high demand with a scarce supply and will pull the market price up. At some point during the uptrend there might be a re-accumulation for a while before the uptrend continues.
• Distribution: This phase sees the composite man selling(distributing) his position to other investors and late buyers until the high demand is completely satisfied. A sideway movement is observed as the composite man distributes his shares.
• Downtrend: As more people buy into the shares of the composite man, the comes a point where the supply is much greater than the demand and the composite man tries to push down the market after he is sold out. The market direction takes a downward slope at this point. In the case of the accumulation where we might observe a re-accumulation, a re-distribution might be observed during the downtrend and some investors could lose money to a bull trap where they buy shares again in a Hail Mary hope that there will be another uptrend that never comes.
The fundamental laws teach us a great deal about when to invest, when to exit, whether or not price trends are likely to continue or change and how certain events affect the market.
The Fundamental Laws are:
The Law of Demand and Supply
Not just in the stock market but the economic world in general is greatly influenced by this law. Asset price direction is determined by this law. When there is a greater demand than supply volume, prices are seen to rise and the reverse causes a fall in price. The composite man uses this to his advantage in the accumulation and distribution phase.
The Law of Cause and Effect
Changes in prices and values of assets are caused by effects of some events in the market. The demand and supply changes causes some effects on the stock market. There is an account or explanation for everything that happens in the market. For example accumulations(cause) normally lead to rise in prices(effect) in the market and distributions(cause) to price drops(effect). We use Point-and-Figure charts to measure a cause and predict the magnitude of its effect.
The Law of Effort Versus Result
The volume an assert has represents its effort. Correlating price and volume is a positive trend continuing signal. However, a divergence or non-correlation between price and volume is normally a red flag that the price trend is about to change. Studying this law is a good way to spot a trend change and not rush into hasty investment where we could potentially lose big.
Share a chart of any cryptocurrency of your choice and analyze it by applying this method. Show clearly the different phases, how the volume changes and give detail of what you're seeing.
The graph from my work is a over a 4hour time range and was taken at 5:27pm Ghanian time from source. I will be using DF/USDT for my analysis.
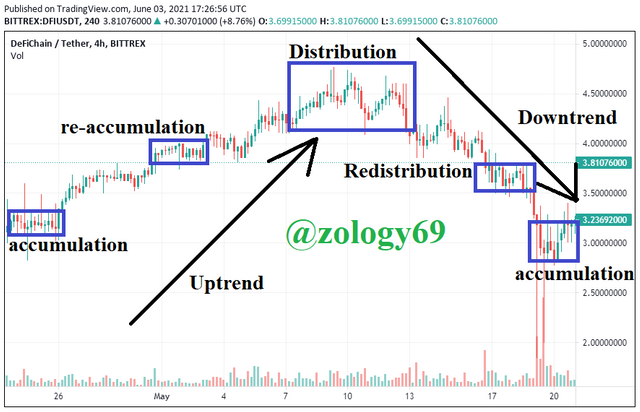
Image taken from source and edited by me in paint application.
• Accumulation: We can observe from the screenshot that there’s no huge volume change and it appears stable during the accumulation phase between 25 to 26June and 17 to 20May. The price is also stable. This is the coin accumulation or collection phase. Investors will try to collect as much coin as they can at this phase.
• Bullish Trend: After the accumulation stage, price is seen to go up and the volume increases as well as people buy into the coin because of the rising prise and attention it is geting. Investors try to push prices up after accumulating enough coins. A re-accumulation phase is noticed between 1st May to 4thMay after the rise in price and attracts investors.
• Distribution stage: At the distribution phase is where investors sell their assets to other buyers. An increased volume as well as price peak value can be observed at this phase.
• Bearish Trend: At this phase, the market acts in accordance with the law of gravitation. What ever goes up must fall back to the ground. A redistribution phase is observed during the downtrend before it hits the accumulation phase again and starts all over. Some buyers still believing the market will rise after the redistribution stage buys the coin and that explains the increased volume observed at the redistribution phase.
The Wyckoff Method even till today is used in analysis of the stock market and to observe and predict the action of the big investors influencing the market by creating an imaginary image of them collectively as the composite man.
It helps us enter and exit the market at points that will ensure maximum profit. We’re also able to make informed investment decisions and not fall prey to losing money by following the general public. Becoming a master in using the Wyckoff Analysis will require time and practice but the perks are totally worth it.
However as informative and strategic as his theory is, it is a theory and not an assurance and can not be 100% relied upon as it is not 100% guaranteed the market will always behave in accordance with this theory.
Thank you for being part of my lecture and completing the task!
My comments:
Nicely done!
All explanations were really good and clear! Also, the chart was correctly identified and analyzed.
Overall score:
6/10
Thank you very much for review professor @fendit but where did I go wrong? I notice I scored a 6/10 which means I didn’t bring in some details you wanted to see. If you could tell me that would be really helpful for my next assignment.