Crypto Academy / Season 3 / Week 8 - Intermediate: Crypto Assets and the Random Index (KDJ)
In your own words define the random index and explain how it is calculated
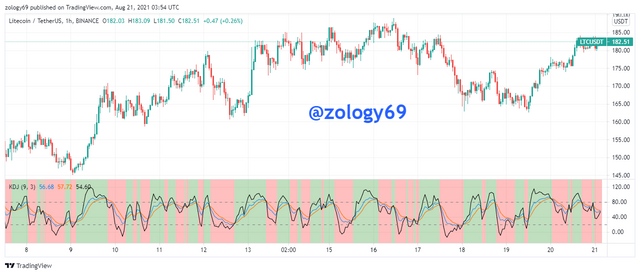
The KDJ indicator is know as the random index indicator. The name KDJ comes from an acronym coined from the 3 lines the indicator has: K line, D line and J line. It differs from the stochastic indicator which has 2 lines with the third J line it has. The J line describes the separation between the K and D line.
Most traders use the intersection of the 3 lines as buy and sell signals. A sell signal is given when after the intersection, the J line is above the K and D line, and a buy signal is given when after the intersection, the J line is below the K and D line.
A number of traders also use the position of the J line relative to 70 to determine if the asset is overbought and 30 to determine if an asset is oversold. An asset is overbought if it crosses over 70 and oversold if goes below 30. For even more accurate signals, some traders consider an oversold asset to be over 80 and an overbought asset to be below 20. Some traders use the oversold and overbought signals of the KDJ as trend reversal signals and as buy or sell signals. Other traders use the KDJ indicator to determine trend direction.
Being a trend following indicator, the KDJ indicator is prone to whipsaws of false signals especially on ranging market. It is better to use the KDJ indicator on a short timeframe like 5m, 15, 30m or even 1h as it responds faster to price changes.
Calculating the KDJ indicator
To calculate the KDJ indicator, we first calculate the RSV for the number of periods we wish to use.
RSV for N-periods = (CN LN) / (HN LN) × 100
Defining terms:
CN = Closing price of asset on Nth day
LN = Lowest price on Nth day
HN = Highest price on Nth day
After calculating RSV, we proceed to calculate K and D values using the expressions:
K of the day = 2/3 × Previous day K value + 1 / 3 × RSV of the day
D of the day = 2/3 × Previous day D value + 1 / 3 × K value of the day
Then finally, we calculate the J value of the day using the expression:
J value of the day = 3 (k value of the day) - 2 (D value of the day)
Is the random index reliable? Explain
What do we mean when we say an indicator is reliable? It basically has to do with the ability of the indicator to give good trade signals over several test cases. It is important to remember that no indicator is absolutely accurately and hence not 100% reliable. All indicators are prone to whipsaws and false signals and the KDJ indicator is not an exception.
However, we can improve the reliability of the KDJ indicator first by adding other indicators to confirm signals giving by the KDJ indicator. Indicators are best used in combination with similar indicators like them. We can use the KDJ indicator in combination with indicators like the ATR and the ADX indicator.
How is the random index added to a chart and what are the recommended parameters? (Screenshot required)
- I first log onto tradingview and I launch my trade chart of interest.
- On the chart, I find the fx option and I click on it. From the indicator search pop up screen, I type in JDK. Then I select KDJ by ll21LAMBOS21
.png)
- My JDK has been added to my trade chart.
Recommended Parameters and how I set them
After we have successfully added our KDJ indicator, we can change the settings to match our trading style. These are the recommended settings for the KDJ indicator. To change these settings, we simply hover our mouse pointer over the indicator and click the gear icon representing settings.
Input
.png)
The recommended input setting is to set period at 9 and signal at 3(default input setting)
Style Setting
.png)
The recommended indicator color line settings are Orange for K line, Blue for D line and Black for J line. I leave the background color setting at green and red for uptrend and downtrend respectively. For more reliable and accurate overbought and oversold signals, I set overbought level at 80 and oversold at 20.
Visibility
.png)
For visibility settings, Seconds should be from 1-59, minutes from 1-59, hours from 1-24, days from 1-366, weeks from 1-52, months from 1-12 and range turned on.

Differences between KDJ, ADX, and ATR
The KDJ, ADX and ATR share some similarities in the way they operate. However, they perform different functions and their difference is below.
| KDJ | ADX | ATR |
|---|---|---|
| Trend Directional Indicator. Shows Direction of trend | Non-directional indicator | Market volatility indicator |
| Measures the | Measures strength of a trend whether downtrend or uptrend | Measures volatility |
| Works best in trending markets | works both in trending market and ranging market | Works best in highly volatile markets |
| Inspired by stochastic oscillator indicator | Modification of an ATR indicator | Moving average indicator |
Use the signals of the random index to buy and sell any two cryptocurrencies. (Screenshot required)
ETHUSDT BUY
.png)
On the 30-minute ETHUSDT chart above, I saw that the black J line of the KDJ indicator intercepts the Orange and Blue K and D lines. This is a buy signal so I take a buy position. I placed my buy stop at $3267 with take profit at $3330 and stop loss at $3233 ensuring R:R was generally a in ratio with higher reward than risk to manage my trade risk. Below is a screenshot of my placed market order.
.png)
Sell XRPUSDT
.png)
In the 15-minute XRPUSDT chart above, I clearly saw the black J line move down from the overbought area. This is a sell signal as price begins to fall after buying pressure increased price. After seeing my sell signal, I placed a sell order at $2.45 with a take profit at $2.38 and stop loss at $2.50 ensuring R:R was in a ratio with higher risk than reward. Below is a screenshot of my order.
.png)
The KDJ indicator is a good indicator for detecting overbought and oversold levels using the position of the J line above 80 or below 20. As a buy signal, we can sell when the black J line crosses above the K and D line after intersection. As much as it might look like the Stochastic indicator, the KDJ is different in the sense that it was a third line, the J line which measures .
This lecture by prof @asaj was really educative and I'll keep practicing with my demo account to fully master the KDJ indicator
Good job @zology69!
Thanks for performing the above task in the eighth week of Steemit Crypto Academy Season 3. The time and effort put into this work is appreciated. Hence, you have scored 7.5 out of 10. Here are the details:
Remarks
Overall, you have displayed a good understanding of the topic. You have performed the assigned task excellently. However, you did not provide new information to this course.
That said, this is good work. Thanks again for your contributing your time and effort to the academy.
Thank you for the review professor. I’ll do better next time.