Crypto Academy Season 03 - Week 08 || Homework post for [ cryptokraze ] Advanced Course - Trading Sharkfin Pattern
What is your understanding of Sharkfin Patterns. Give Examples (Clear Charts Needed)
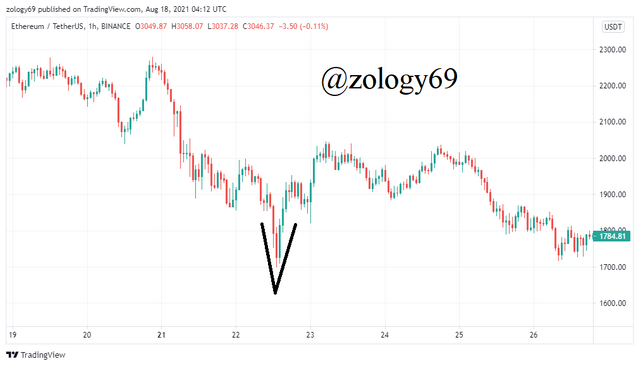

Also, in the 30-minute BTCUSDT chart above, we see a sharkfin pattern as price movement forms an Inverted V shape by the quick movement up and reversing back down again.

In the 30-minute CAKEUSDT chart above, price quickly goes up and reverses back down again forming an inverted V shape.

Implement RSI indicator to spot sharkfin patterns. (Clear Charts Needed)
Trading based on your observation of the shark pattern is risky as prices might not make a retracement back up or down and the current trend or price action might just continue. For this reason, we need to use the sharkfin pattern in combination with indicators particularly the RSI indicator to spot good sharkfins. I am going to add my RSI at default settings with length of 14 and bands at 70 and 30. When price makes quick moves upward and back down or vice versa, I watch the RSI to confirm.
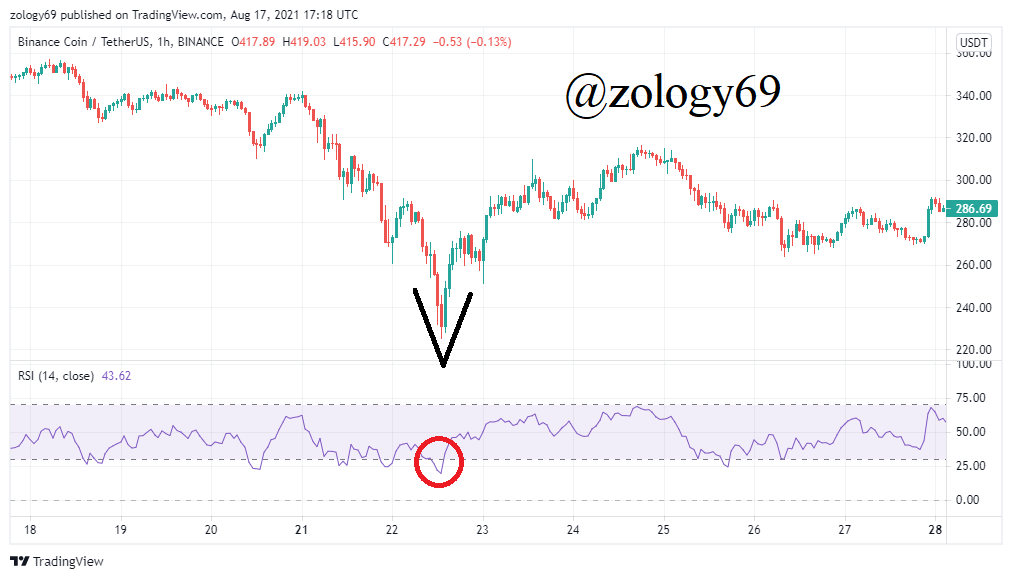
In the 1-hour BNBUSDT chart above, we see how the sharkfin pattern forms a V shape from quick up and down movement of price. The RSI also quickly going below and above 30 in a V shape confirms that this is a good sharkfin and we can make enter a position using it.

In the 1-hour ALICEUSDT chart above, the sharkfin pattern is seen by price action forming an inverted V shape as it quickly goes up and back down. A sign that this is a good sharkfin to enter sell position on is the RSI going beyond 70 and coming back down quickly in an inverted V shape.

The 1-hour LTCUSDT chart above shows a good sharkfin as price quickly goes down and back up, forming a V shape while at the same time, RSI quickly goes below and above 30 also forming a V shape.

In the 1-hour LTCUSDT chart above, we see a good sharkfin pattern as a V shape forms by price action quickly moving down and back up, while the RSI also forms a V shape as it quickly goes below and above 30.
Write the trade entry and exit criteria to trade sharkfin pattern (Clear Charts Needed)
Let’s look at trade entry and exit criteria using the sharkfin pattern and RSI together.
Trade Entry Criteria
Buy Position Entry Criteria
- I start by launching my chart and adding my RSI(with default settings) which I’ll use to spot a good sharkfin pattern
- Since sharkfin pattern works on quick price movements, I wait for a quick price movement in the downward direction and back up to describe a V shape.
- I then check my RSI to see if the RSI has quicly gone below and above 30 to form a V shape too.
- After I clearly see the RSI go back above 30, I place my buy order.
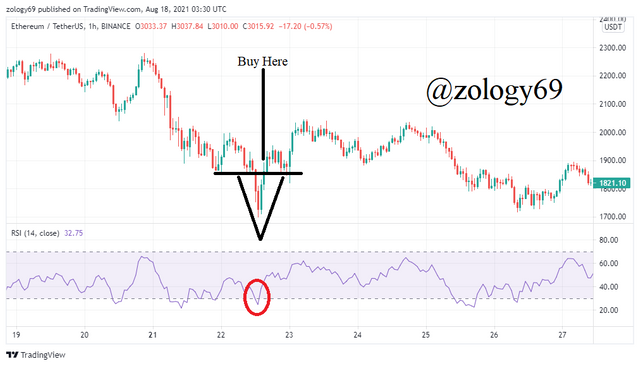
The 1-hour ETHUSDT chart above shows a sharkfin in V shape forms as price quickly goes down and back up. We see clearly how the RSI also quickly goes below and above 30 in the same V shape. A good sharkfin has been spotted and I place my buy order.

Sell Position Entry Criteria
- First, I launch my chart and add my RSI with default settings to spot a good sharkfin.
- I then wait for price to make a quick upward movement and back down to show the sharkfin with an inverted V shape.
- I turn to my RSI to see if the RSI makes a similar movement by quickly going above and below 70 forming an inverted V shape.
- I make sure that the RSI clearly goes back below 70 and I place my sell order.
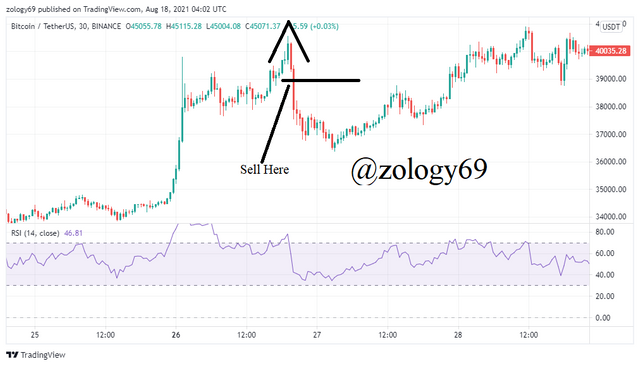
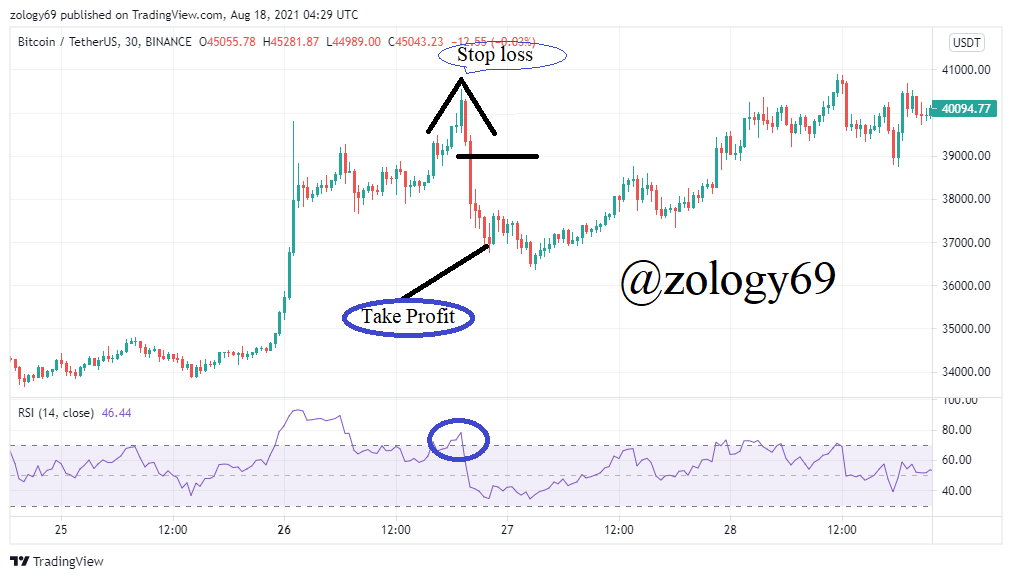
In the 30-minute BTCUSDT chart above, a sharkfin forms an inverted V shape as price quickly goes up and back down. We also see how the RSI quickly goes above and below 70 in an inverted V shape. A good sharkfin which suggests price will fall has been spotted and I place my sell order to cut my losses.

Exit Trade Criteria
Exit Criteria For Buy Position
- My buy position is supposed to come after a downtrend reverses into an uptrend so I set a stop loss below the swing low point of the sharkfin in V shape in case no reversal happens and price continues to dip.
- I exit the trade setup and wait for another trade setup if price crosses the stop less level as the sharkfin trade setup becomes invalidated.
- I am entering this trade for profits with a calculated risk so I set a take profit at a 1:1 R:R equal to my stop loss
- I book my profits and exit trades when price reaches my take profit level. I am in this for the profit after all.
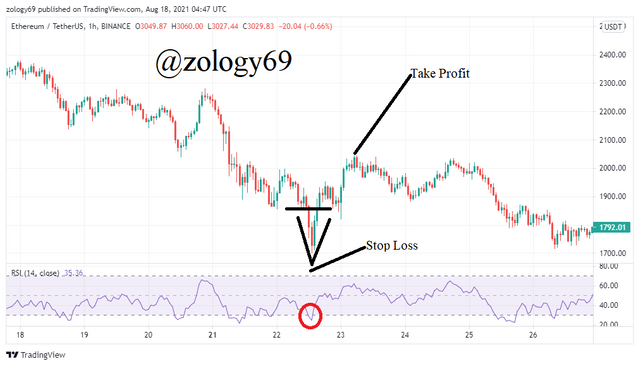
In the 1-hour ETHUSDT chart above, I set my stop loss below the swing low point of the sharkfin so that incase there’s no price reversal upward and the downtrend continues, I exit the trade. Then I set a take profit after price moves up to take profit if the trade goes how I anticipate.

Exit Criteria For Sell Position
- My sell position is supposed to come after an uptrend reverses to a downtrend so I set a stop loss above the swing high point of the sharkfin in case no trend reversal happens and price continues in an uptrend.
- The trade is invalidated if price crosses the stop loss level and we’ll have to wait for another sharkfin opportunity.
- I am entering this trade for profits with a calculated risk so I set a take profit at a 1:1 R:R equal to my stop loss.
- I take my profit and exit trade when price reaches my take profit level as the whole point of the trade is to make profit.

In the BTCUSDT chart above, I set my stop loss above the swing high point of the sharkfin so that in case there’s no price reversal downward and the uptrend continues, I exit the trade. Then I set a take profit after price moves down to take profit if the trade goes my way.
Place at least 2 trades based on sharkfin pattern strategy (Need to actually place trades in demo account along with Clear Charts)
The Market was in a bearish phase at the time I did my assignment and I was only to spot buy entry trades. I took the screenshots for my trades from my demo account at forexwebtrading
ETHUSD Buy Entry Trade
.png)
The chart above shows my purchase of ETHUSD using the sharkfin pattern and RSI. Once I saw a quick down and up movement of price in a V shape, I added my RSI indicator and I saw that the RSI also quickly moved down below 30 and back up above 30 again. Then I entered trade at $3066 after I clearly saw the RSI rise back above 30. I set my stop loss at $2940, below the lowest swing and my take profit at 3193.1 which is in a 1:1 R:R with my stop loss.
BCHUSD Buy Entry
.png)
In the BCHUSD chart above, I added my RSI to confirm a good sharkfin after I saw quick price movement up and down in a V shape. After I clearly saw that the RSI moved down below 30 and back up above 30 quickly, I entered a buy position at $647.8 setting my stop loss at $618 below the lowest swing which is in a 1:1 R:R with my take profit at $670.6
LTCUSD Buy Entry Trade
.png)
Finally, in the 1-hour LTCUSD chart above, I entered a buy position at $171.4 with a stop loss at $162 in a 1:1 R:R with my take profit which was at $18. I entered this position after I confirmed a sharkfin formed in a V shape with RSI quickly going below 30 and going back up above 30 in a V shape also.
Conclusion
The sharkfin pattern is a way to quickly enter positions of profit or exit positions of loss many times in a day by observing quick price movement patterns. As price movement is supposed to be quick, the sharkfin pattern is observed using shorter time frames like 1-hour or even 30minutes depending on what suits you best.
Combining with the RSI gives very good results and can help spot good sharkfins to trade based on. If the RSI moves in conformance with the sharkfin pattern going below and above 30(forming a V shape) or quickly going above and below 70(forming an inverted V shape), the sharkfin is a good one to trade on.
I enjoyed my first lecture under professor @cryptokraze and I look forward to learning more from you sir. Thank you for reading.