Confluence Trading - Crypto Academy / S5W6- Homework Post for @reminiscence01
Explain Confluence trading. Explain how a trade setup can be enhanced using confluence trading.
Trading in the crypto market is very risky and requires you to be smart about it. To make profit in the crypto market, you’re trying to take money from very smart people called whales, who are also plotting schemes to take your money. For this reason, it is best we study the signals in the market and make sure our different indicators and trading tools are giving the same signals so that we don’t fall victim to false movements that these whales may cause to confuse and trap naive investors. When we trade using signals from multiple indicators or trading tools that match our trading style to increase our chance of making profits, we’re practicing confluence trading.
In confluence trading, we find trade setups using multiple signals from different indicators or trading indicators that are giving off the same signal whether buy or sell. Confluence involves the use of several buy or sell signals from different trading tools to confirm or dismiss a trade decision. For example, we can use simple support and resistance levels in combination with a moving average to determine good entry and exit points in the market.
To enhance a trade setup using confluence trading, we enter trade positions only when we’re getting the same signal whether entry or exit from multiple technical indicators or trading tools. This way, we’re confident in the position we’re taking and will not be influenced by sentiment. By taking confident trade positions based on multiple signals, we’re more likely to make more profit and cut short or minimize our losses by avoiding trading on false signals.
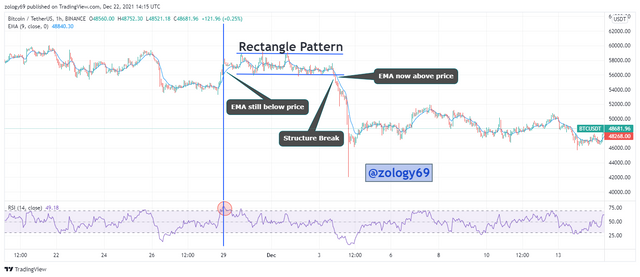
In the BTCUSDT chart above, I have added the RSI and EMA and identified and rectange pattern on the candlestick chart. We can see how the RSI showed an overbought signal indicating that there is about to be a reversal to the downside but what does the EMA do? The EMA is still moving below price indicating that the movement is still bullish and will not reverse.
Then we later see that price breaks out of the rectangle pattern to the downside suggesting that there will be a reversal to the downside. The EMA confirms this reversal when it now changes and moves above price. Traders would’ve acted on a false signal if they entered a sell position based on the immediate reversal signal of the RSI. This is a clear example of how confluence trading will help enhance a trade setup.

Explain the importance of confluence trading in the crypto market?
Some traders do not like practicing confluence trading because they like to have a clean chart, others don’t have knowledge on a many trading tools, indicators and patterns. However, for traders that practice confluence trading comes a lot of great merits. These are some reasons why practicing confluence trading is important.
Filtration of False Signals : Indicators are bound to produce false signals at some point in the market because of noise. These signals could be due to deliberate attempt by whales to confuse and take advantage of young traders. Practicing confluence trading, an indicator or tool that produces a false signal will be detected by the other indicators and a trader will only trade with the signal given by multiple trading tools.
Confidence in trades : Traders are generally more confident in their trades when they see multiple reasons pointing in the direction of their trades. Once a trader practicing confluence trading gets multiple signals to take a position, no amount of noise in the market will change their mind, hence they do not fall victim to manipulation by the big fishes of the market and do not trade based on sentiment.
Increased chances of profit : making trade decisions using the right signals will maximize our profit and reduce our losses. What better way is there to be sure your signal is right than when multiple indicators are giving you the same signal?
Instills Discipline and Control In Trader : A trader practicing confluence trading learns discipline and only makes moves when multiple trading tools suggest he should. This puts him in control of his trade and he doesn’t stray to fall to distractions or market psychology tricks like FOMO.
Identification of Good Valid Trade Setups : With confluence trading, use multiple tools all of which give trade signals. The trader uses the collective confluence of all these trading tools to identify which trade setup is a valid and profitable and which will might lead him into a trap.
Maintaining Good and Healthy Risk Management : Being a confluence trader gives you the added benefit of having a good risk management system which will prevent a trader from going completely bankrupt or suffering huge losses. The risk management will maximize profit whilst at the same time, keeping losses as minimal as possible.
Explain 2-level and 3-level confirmation confluence trading using any crypto chart.
Depending on how many indicators we use in confirming our confluence trade, we have 2-level and 3-level confluence trading. If we use 2 trading tools to confirm our confluence trade, then we’re using a 2-level confirmation confluence trading. Likewise, a 3-level confirmation confluence is when we use 3 tools to confirm our confluence trade. Let’s look at some instance involving a 2-level and 3-level confirmation confluence trading on the same chart.
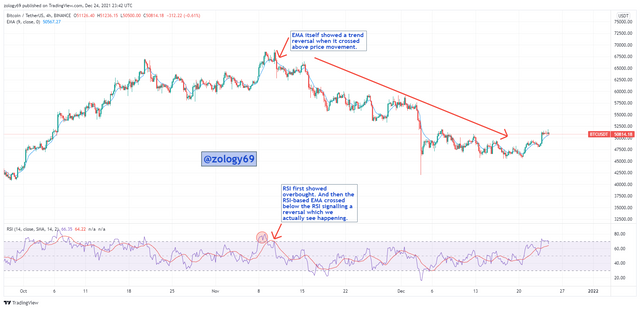
In the 4-hour BTCUSDT chart above, observe how a trend reversal was spotted using a 2-level confirmation confluence. First, the RSI showed overbought by crossing 70, suggesting that there will be a reversal. However, we see that price doesn’t immediately reverse and is trading above the EMA. The EMA then confirms the reversal a short time later by crossing and moving above price. The RSI-based EMA also does same as can be seen in the screenshot above.
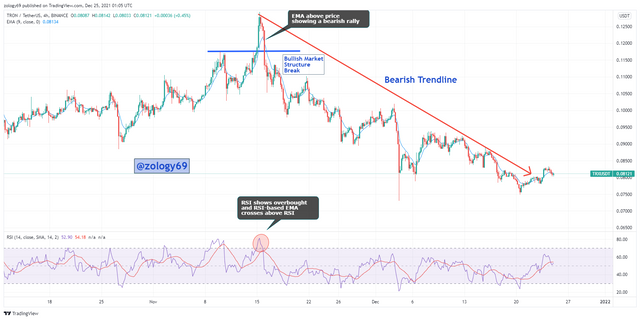
In the 4-hour TRXUSDT chart above, a bullish reversal is spotted with a 3-level confirmation confluence. We first see the RSI show an overbought signal when it crosses 70. The RSI-based EMA also crosses above the RSI indicating a bearish movement or a bullish reversal. The EMA itself breaks above price and we see a break of bearish market structure into a newly developed bearish structure with a bearish trendline.
Analyze and Open a demo trade on two crypto asset pairs using confluence trading. The following are expected in this question.
• a) Identify the trend.
• b) Explain the strategies/trading tools for your confluence.
• c) What are the different signals observed on the chart?
Demo Trade 1: TRXUSDT Buy Demo Trade
a) Identify the trend.
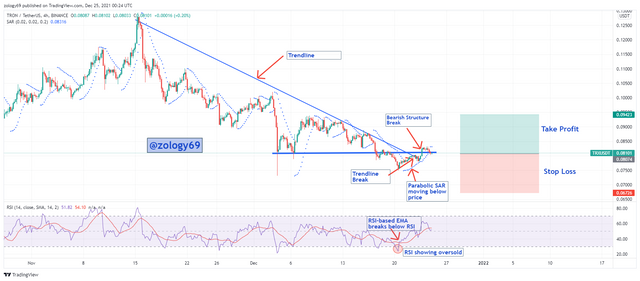
The trend as seen from the screenshot below is a bearish trend. This can be seen from the bearish trendline, and the lower highs and lower low market structure of a bearish trend.
b) Explain the strategies/trading tools for your confluence.
In my confluence trade, I used two indicators, the RSI and the parabolic SAR. I also used trendline and market structure to confirm a bearish reversal. The RSI signals oversold when it goes below 25 and the RSI-based EMA went below the RSI signal line. Both these from the RSI signals a reversal to the upside and suggests I take a buy position. The Parabolic SAR also goes below price movement, indicating a bullish rally which also suggest I take a buy position. In addition, we see a break in the bullish trendline and a break in bearish market structure which is a bearish reversal signal.
.png)
A short while after the RSI shows oversold, the Parabolic SAR also moves below price indicating a bullish movement. The bearish trendline is also broken shortly after followed by a break in bearish market structure. I take my buy position when price seems to make a retest to the point of market structure break with a 1:1 R:R ratio. Below is how I placed my buy order.
.png)
.png)
c) What are the different signals observed on the chart?
On my chart, there are several signals all of which point to one trade signal, a buy signal.
An oversold signal from my RSI going below 25.
A bullish signal from Parabolic SAR going below price movement.
A break of bearish trendline, and a break of the lower high and lower low bearish market structure.
Demo Trade 2: DOTUSDT Sell Demo Trade
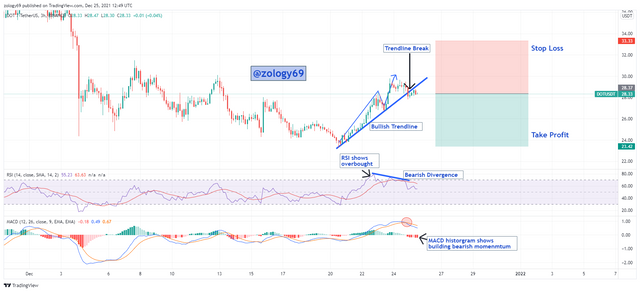
a) Identify the trend.
The trend as seen from the screenshot below is a bullish trend. This can be seen from the bullish trendline, and the higher highs and higher low market structure of a bullish trend.
b) Explain the strategies/trading tools for your confluence.
In my confluence trade I used two indicators, the RSI and MACD. I also used trendline and market structure to confirm a bullish reversal. The RSI signals overbought when it goes above 70. The RSI-based EMA also went above RSI signal line. Both these from the RSI signals a reversal to the downside and suggests I take a sell position. We also observe that while price is making higher highs and higher lows, the RSI is making lower highs and lower lows, a situation called a bearish divergence suggest a reversal to the downside. We also notice the bullish trendline break suggesting a bullish reversal. The MACD signal line also crosses above the MACD, with the MACD histogram showing building bearish momentum.
.png)
Not long after the RSI shows oversold, the bullish trendline breaks. The MACD signal line crosses the MACD, and the MACD histogram shows building bearish momentum immediately after the trendline break and I take my sell position then with a 1:1 R:R ratio. Below is how I placed my sell order.
.png)
c) What are the different signals observed on the chart?
On my chart, there are several signals all of which point to one trade signal, a sell signal.
An overbought signal from my RSI going above 70, and a bearish divergence from the lower high conformation of RSI while price makes higher highs. These are both bullish reversal signals.
A bearish signal from MACD signal line going above the MACD and MACD histogram showing building bearish momentum.
A break of bullish trendline.
Trading in the crypto market, as profitable as it can be, is also a very risky venture. More experienced whales and crypto influencer’s are setting baits and causing noise in the market to distract inexperienced traders and possibly make them take trade decisions based on sentiment. This will cause them to fall prey to their traps and lose huge sums of money if not all their money.
Confluence trading helps traders avoid this by only taking trade positions when multiple trading tools are giving the same signal. This way, noise and false signals in the market will be filtered and the trader can easily identify good and valid trade setups. Confluence trading also gives the trader confidence in their trade, so the trader won’t flinch and fall prey to market psychology tricks like FOMO. With confluence trading, we implement risk management strategies like limit orders, stop-limit and TP+SL orders.
CC: prof @reminiscence01
All screenshots from my publication are taken from tradingview
Hello @zology69, I’m glad you participated in the 6th week Season 5 of the Beginner’s class at the Steemit Crypto Academy. Your grades in this task are as follows:
Observations:
That's correct.
Recommendation / Feedback:
Thank you for submitting your homework task.