Leverage With Derivatives Trading Using 5 Min Chart -Steemit Crypto Academy | S6W1 | Homework Post for @reddileep

Hello steemians, I would love to join Prof. @reddileep to congratulate each and everyone for reaching the sixth season of the crypto academy. This week's topic is Leverage With Derivatives Trading Using 5 Min Chart and I'll try my best to give detailed answers to the test questions listed. If you reach the requirements, you could join me to do same by reading up the lesson on this link.

1.)
Introduce Leverage Trading in your own words

Leverage trading has been in existence for a long time now. It is simply a trade that is done with borrowed funds. To be more detailed on the definition, leverage trading is the use of a feature on an exchange to maximise a trader's funds or positions for a particular trade.
For example, if a trader has $50 in his wallet and makes a trade which gave him a profit of 50%. It means he only makes $25 but using the leverage feature, the trader can request for more funds from the exchange by selecting a multiplier (2x, 4x, or even 10x). If he uses a 4x, this means he would make $100 worth of profit for that trade.
On exchanges like binance, the leverage feature is applied in the derivatives (futures trading) and the margin trading. When using margin trading, the amount of money a trader has for the trade is known as the margin but he can expand his purchasing power by requesting for additional funds from a broker. For further understanding of the terms I stated above, "a trade with 20% margin means that 20% of the funds in this trade is from the trader's portfolio and the remaining 80% is gotten from the broker". This means the trader used a 5x leverage multiplier.
The sad thing about leverage trading is the same way a trader maximizes his profit, he can also maximise his loss and get liquidated.
2.)
What are the benefits of Leverage Trading?
Here are the advantages of leverage trading below, although its major advantage is increased profit.
1.) Higher Purchasing Power: Leverage trading gives traders the ability to control a more funds in order to acquire larger positions when making their trades.
2.) Small trend reversals produce high profits: More money brings higher profits. In a scenario where a trader only has $10 available to him for a trade which may profit him with $1, leverage trading can give the trader an option to use the 10x feature which will bring up his profit to $10.
3.) Taking out early profits: Leverage trading gives traders in the market and option to take out some amount of the profit already made without ending the trade.
4.) Creation of Opportunities: There are number of traders out there who have a broad knowledge about the analysis behind trading but don't have enough capital to make good profits. Leverage trading gives this set of people and opportunity to increase their trading positions.
3.)
What are the disadvantages of Leverage Trading?
1.) High risk of Losses: Risks are so high when trading with leverages which means, the same way it increases the amount of profit to be made by traders it can also maximise the amount of losses.
2.) Fees: In leverage trading fees are charged at intervals for holding these borrowed funds. This is so different from the spot trading where you can save up funds for ever with out being taxed.
3.) Margin calls: In a scenario where the margin trading account runs low on funds, the broker can request the trader adds his own funds to the account. If he not able to, there will be forced liquidation of all his assets.
4.)
What are the Basic Indicators that we can use for Leverage Trading?
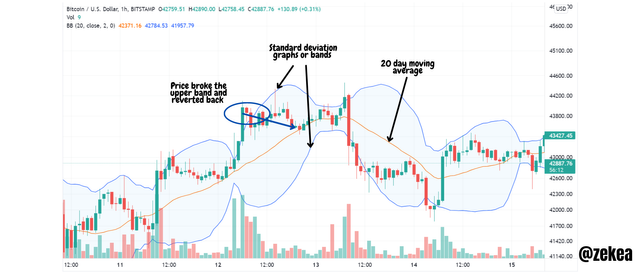
The Bollinger bands is a special type of indicator that helps traders identify fake trend reversals. It is an indicator made up of two standard deviations which is a plotted above and below a 20 day moving average. The bollinger bands indicator predicts that price will not go above or below the bands. The standard deviation graphs above and below try to contain the movement of prices within them. In a scenario where the price breaks these bands, the trend reversal is false. Just like you have seen above, there was a breakout of the price which looked like the market was about to go into an uptrend but it reverted back.
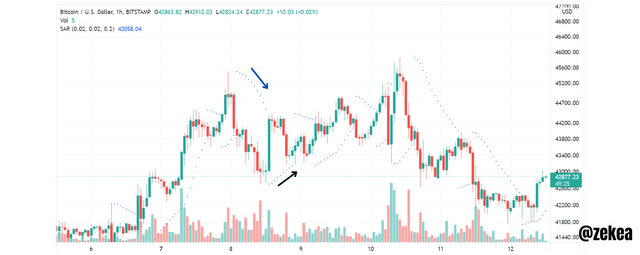
The parabolic Sar is an indicator which is used to identify the direction of the next trend in the market. It was invented by Mr. Welles Wilder Jr. When using the parabolic Sar, if the indicator is highlighted above the price action, it signifies a downtrend but if the indicator goes below the price action, it signifies an uptrend.
We can see that in the screenshot above.
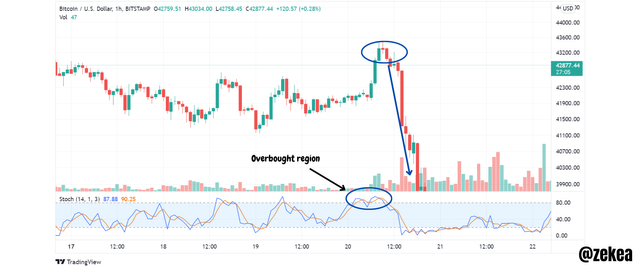
The stochastic indicator is a leading indicator and one of the most important indicators to use while trading. This indicator sends signals of trend reversals very quickly by notifying the trader when an asset is overbought or oversold. It is almost the same with the RSI indicator.
The stochastic indicator has a calibration, 80-100 means the asset is in the overbought are and 0 to 20 means the asset is in the oversold area. In the illustration above, we can see that the asset is in the overbought area and it signals an upcoming downtrend.
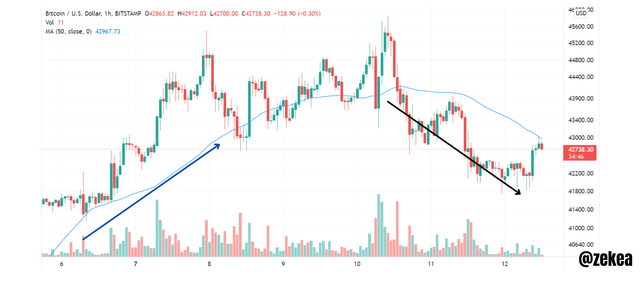
The moving average is a lagging indicator that is used to confirm a trend reversal. It was invented in the 1970s by Gerald Appel. Since the moving average is a lagging indicator, it is sometimes used for long term trades. When the average line drops below the price, it signifies the beginning of an uptrend but when the average gets above the price, it signifies the start of a downtrend.
5.)
How to perform Leverage Trading using special trading strategies
Using some of the indicators we learnt above, we will do some technical analysis to determine how to trade with them. Lets's first start with the buying strategy.
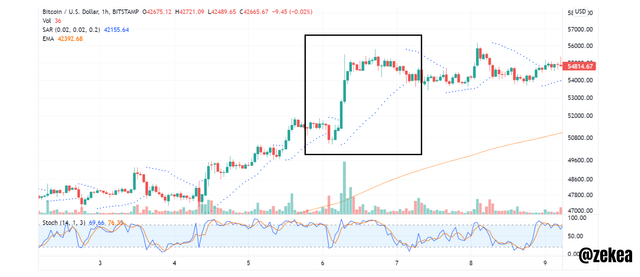
1.) Before checking any other indicator, the first thing to check is the EMA indicator. For this analysis, I'll be using the 200 period. Like we've seen above, the EMA indicator is below the price action and this simply means a bullish trend continuation.
2.) Like we learnt from the Professor's class, the next thing to look at is the area where the parabolic sar indicator falls. In the chart above, the parabolic SAR appeared under the price action which means it is a good time to make a long trade but for further confirmations we have to take note of what the stochastic indicator signals.
3.) On the stochastic, we can see that the indicator just entered the oversold region which is below 20. This signifies a bullish reversal. We finally have confirmation to enter a long trade.
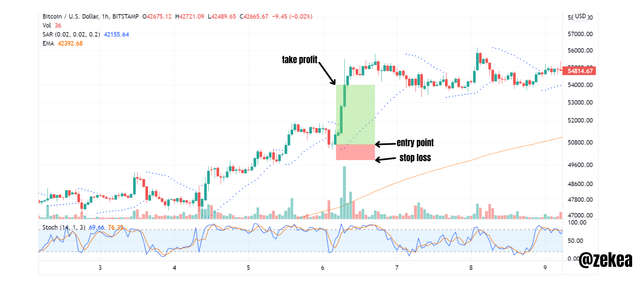
4.) Now, to detect our entry point, stop loss and take profit, we can use the parabolic sar. The take profit should be set towards the end of the parabolic sar curve below while the stop loss should be set slightly below our entry point.
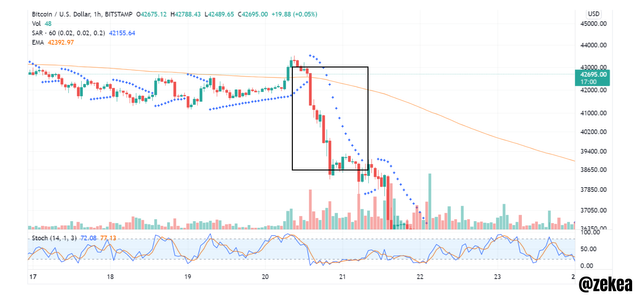
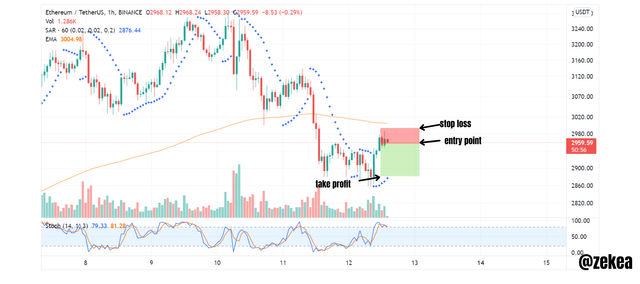
1.) The same thing applies here, we start from checking the EMA. From the charts, we can see that the EMA just reversed to sit on top the price action. This confirms a downtrend.
2.) From the parabolic SAR, we can see that it is also above the price action so we should be preparing to make a short trade.
3.) Since the stochastic is in the overbought area, it means a bearish trend is about to begin. This confirms the trade.
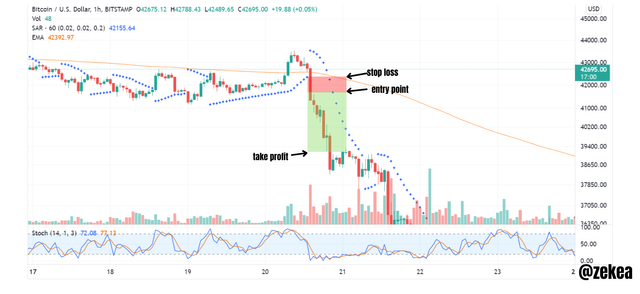
4.) From the chart above, I have inputed my entry point, stop loss and take profit region.
6.)
Do a better Technical Analysis considering the above explained trading strategy
This a 15min chart for ETH/USDT pairs. From my analysis, the EMA indicator was above the price action which gave me the signal for a sell trade. When I used the parabolic sar, it did not yet signify a change in trend from the current uptrend to a downtrend but the stochastic indicator was on the overbought region. With what I saw, I went ahead to place short sell trade.
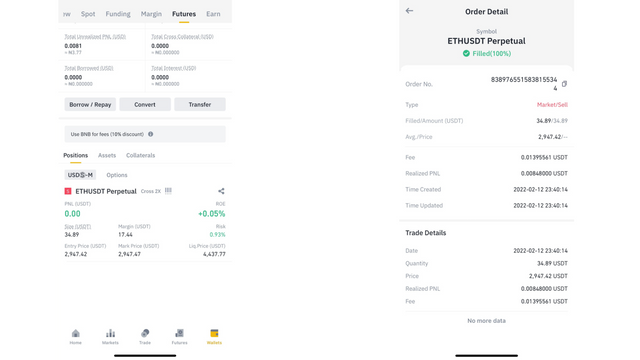
Above is the trade I did on Binance futures. On this trade, I used a 2x and sold ETH at $1947.42 to give me $0.00828 profit at the end of the day.
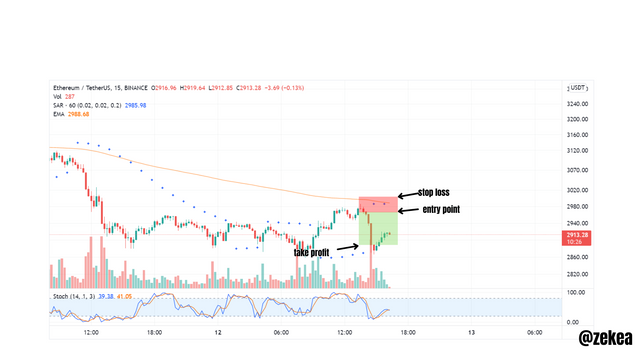
This was my chart at the end of the day, which means if I waited a bit longer I would have made more profit from this trade.
Conclusion
Leverage trading is a very risky method of trading cryptocurrencies due to the unpredictability and high volatility of the crypto markets but no good thing is acquired without taking risks.
This method of trading offers its users the ability to increase their margin in order to acquire large amounts of profits. I hope to learn more about it and make more trades using the feature soon. Thank you Prof. @reddileep for this wonderful lesson.