Crypto Trading by Identifying Support and Resistance -Steemit Crypto Academy | S6W3 | Homework Post for @shemul21

Hello steemians, I would love to join Prof. @shemul21 to welcome each and everyone of us to week three of crypto academy season 6. The topic for the week is Crypto Trading by Identifying Support and Resistance and for those who would love to participate, you can do so by reading this link.

What is the Support & Resistance zone?

Resistance and Support zones are the first thing a technical analyst must highlight and take in to consideration before making any decisions on the chart. This is because they give traders a clear vision to understand what is going on in the chart and with these, they can predict future price movements in the market.
Support Zone
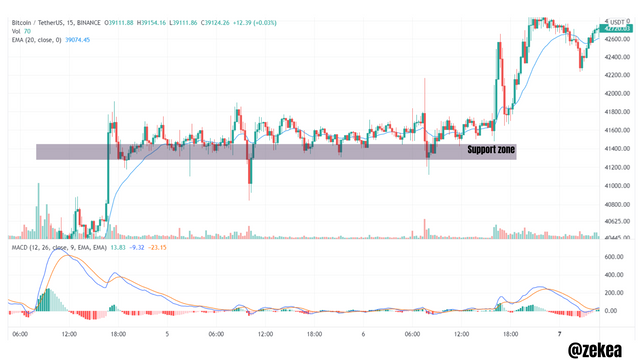
The support zone is technically the area or region of the lowest prices attained on the chart. Just like you have seen above, the support zone is highlighted beneath the lowest price points on the chart. If you notice, price keeps consolidating in a zig zag manner, it moves in a bearish trend, hits the support level and moves back up. These goes on and on.
In order words, the support zone is just like a safe zone for traders, it is a fact that price will hardly fall lower than that level and most of the time can be used as a take profit level for a sell-trade. This means that traders who sold assets will buy back at the support level.
Resistance Zone
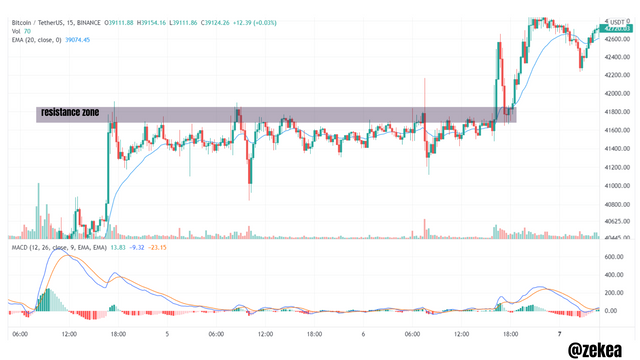
The resistance zone is usually the area with the highest price points on the chart. It has an opposing force which reverses bullish trends. This means that as price approaches the resistance zone it reverses.
The resistance zone acts like a barrier which prevents the prices in the market from increasing. Price hits the resistance level and returns back to the support. This goes on and the market forms a zig zag pattern until a break. All traders who make buy-trades place their take profit levels around the resistance zone.
However, we must also note that, as price keeps hitting the resistance and support level, these zones get weaker and there will be a breakout in the long run. A breakout at the support level causes a bearish trend while a breakout at the resistance zone causes a bullish trend.
Explain different types of Support & resistance with proper demonstration
Support and resistance zones can be highlighted in three different ways
- Horizontal zones
- Sloping or diagonal zones
- Dynamic zones
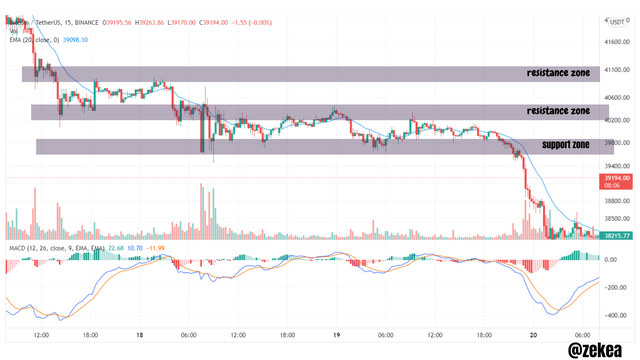
If you look at the chart above, the resistance and support level were drawn horizontally. Before I read the post from the professor, this was the only type of resistance and support zone I knew. The horizontal zone is the conventional type of zone used in price action analysis. Like the name implies, at the resistance, it is the highest level price has attained horizontally and at the support, it is the lowest price attained horizontally. There is a horizontal force which reverses all price movements approaching that level.
Although, as price keeps hitting that level, the horizontal resistance and support zone will get weak and there will be a breakout leading to a trend continuation.
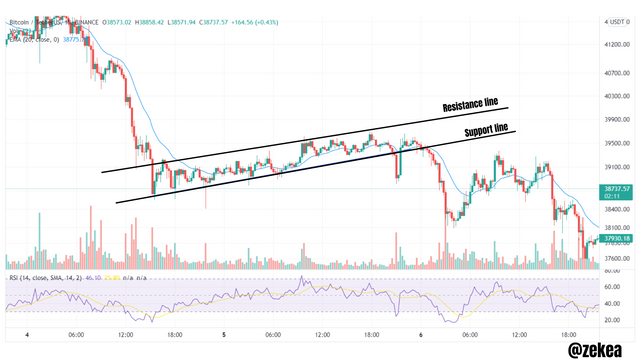
If you look at the chart above, this type of zone is quite different. The sloping zones are types of support and resistance lines formed and bounded diagonally. This type of zone either slopes in an uptrend direction or a downtrend direction. For an uptrend direction, price seems to attain higher highs at the resistance and higher lows at the support. For a downtrend direction, price attains lower lows at the support and lower highs at the resistance. The one on the chart above is in the uptrend direction.
Just like the horizontal zone, if price happens to break from the sloping resistance line, there will a bullish trend continuation and if price breaks from the sloping support line, there will be a bearish trend continuation.
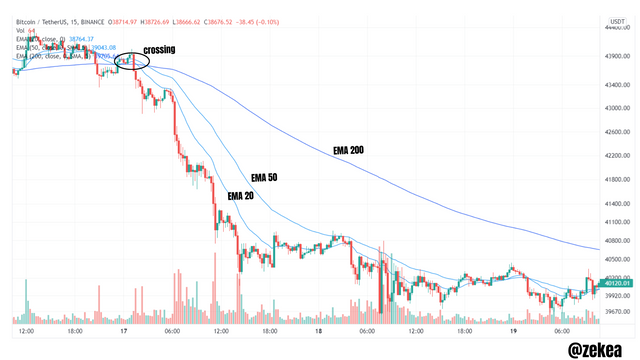
Dynamic zone are very much different from the rest, instead of the use of lines, moving averages are used areas of support and resistance. On the chart, there exponential moving averages are oscillating above price, this acts as a resistance level in the market. When using the EMA for support and resistance levels, you can use the 20 day, 50 day or 200 day EMA.
Just like the other resistance zones, when price crosses these moving averages, we should expect a trend reversal. The 20 day just calculates the mean of past prices for just 20 days and this is perfect for short term or intraday trading but the 200 day is more accurate. If you look at the chart above, when price crossed the 200 day EMA, it caused a downtrend. I'll give an example for the support below.
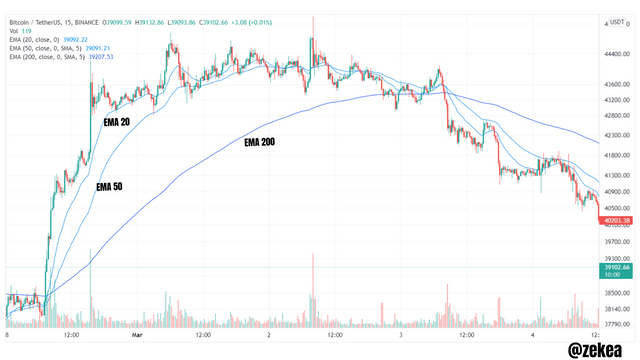
For the support, the moving averages are below the price action this confirms a healthy bullish trend but at the point where price crossed, it as reversed to a downtrend.
Identify The False & Successful Breakouts
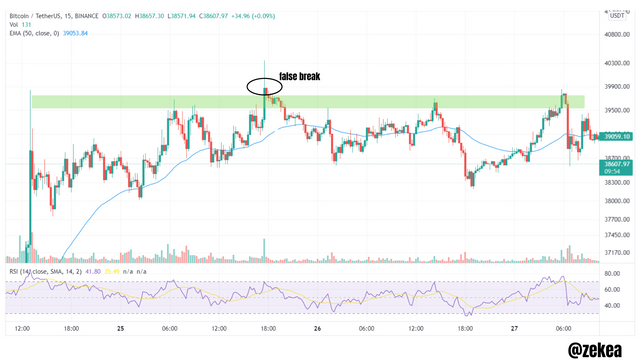
A false breakout is an occurrence on the chart, where price hits the support or resistance level, temporarily breaks out but suddenly reverses in trend. This is a serious and unexpected happening that leads traders into huge losses. The false breakout occurs because the trend was not so strong to continue.
From the chart above, at the highlighted area, the price just moves above the resistance area then suddenly reverses back.
A successful breakout is an accurate breakout. As we all know, a breakout is a point where price breaks the resistance or support level to engage in a trend continuation. There are to types of these succesful breakouts.
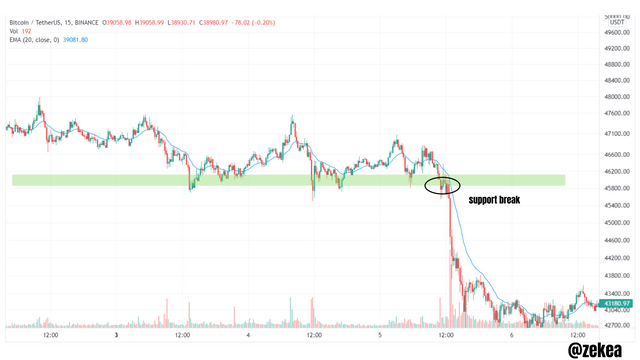
In this type of break out, after the price pushes out of its resistance and support areas, the market still continue moving in the same trend. As we can see above, after breakout price still moves in a downtrend.
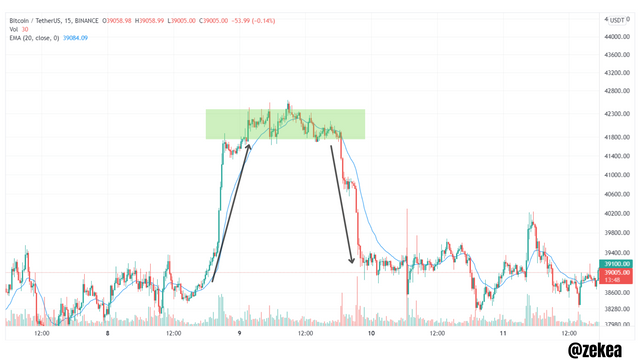
In this type of breakout, price hits the resistance and support zone aggressively, moves into a trend for a while then suddenly the market consolidate (consolidating here means there is confusion in the market to decide the next trend). Finally at a point, the market reverses to another trend.
We can see that in the chart above, price breaks the resistance, moves into a strong bullish trend then consolidates for a while before reversing to a bearish trend.
Use Volume and RSI Indicator Combined with Breakouts & Identify the Entry Point
The volume and RSI indicators play a big role in filtering breakouts. When there are high amount of trading activities in the market, the volume indicator highlights it. This means that if a large volume of assets where bought while the price was at the resistance level, there will be a true breakout leading to a bullish trend continuation and if a large volume was sold at the support level, there will also be a true breakout leading to a bearish trend.
For the RSI indicator, for a resistance breakout, if the indicator is above the 50 mark and point upwards it confirms a true bullish breakout and if the indicator signals below the 50 mark, pointing downwards, it confirms a true bearish breakout.
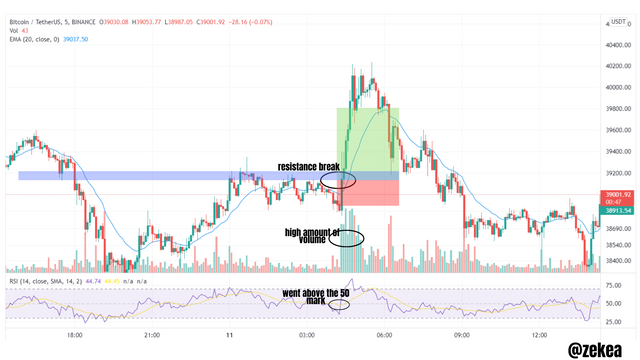
From the trade above, we can see that price broke the resistance level with very large quantities of volume and once the RSI indicated was above the 50 mark (also pointing upwards), it signified that the market was going into a bullish trend.
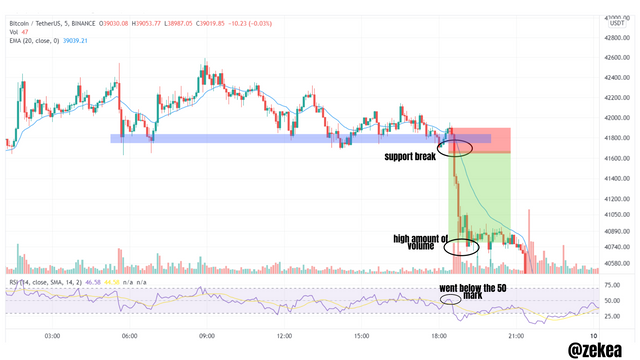
In the chart above, the price broke the support level with very large quantities of volume and once the RSI indicated was below the 50 mark (also pointing upwards), it signified that the market was going into a bearish trend.
Take a Real Trade(crypto pair) on Your Account After a Successful Breakout
For this trade, I used the ETH/USDT pairs on binance.
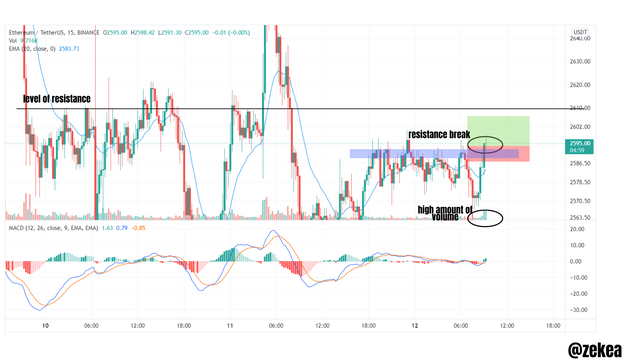
Looking at the cahrt above, price broke the resistance level, and there was high amount of volume on the chart with the EMA 20 which crossed under the price. Weighing my option, I decided to place a low risk trade with my take profit below the next resistance level above.
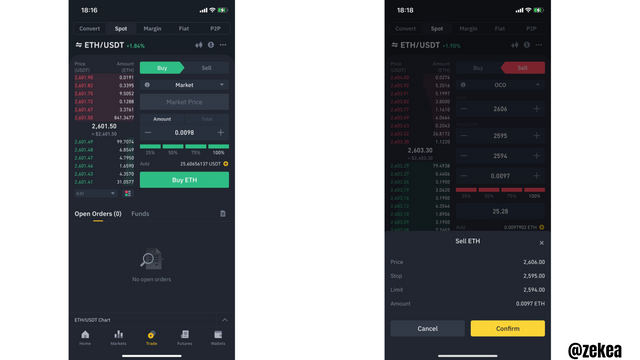
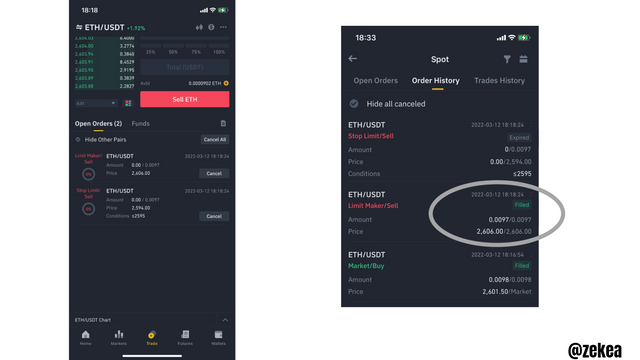
I bought the 0.0098 ETH and place an OCO sell order in other to include my take profit and stop loss level. My entry was at 2601.5 and my take profit was at 2606.
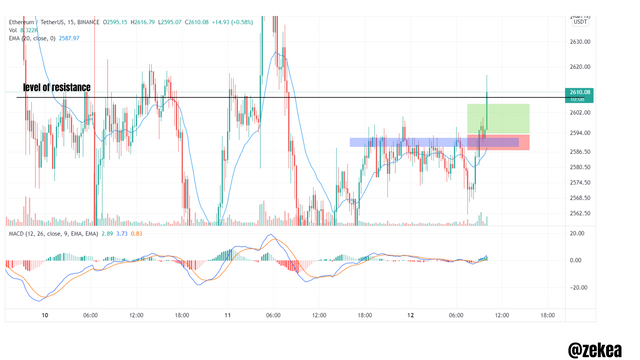
Looking at the chart above, price surpassed my take profit level and I made some profits. The confirmation of the trade is below.
Explain the Limitations of Support & Resistance
All trading analysis techniques have their limitations, there is always a possibility of faults. The support and resistance analysis are very useful but there is still a tendency of faulty or wrong break outs. As we have seen the charts in third question. Price can break the support or resistance level and instead of us seeing a strong trend, we will see a fall back or reversal. When this happens, it can be very fatal to traders that may be away from the chart leading to high losses.
Analyzing the false breakouts, some analysts wait for a retest before entering the market with some indicators like the ones I have explained above. These may help but to be honest, these methods aren't 100% reliable because the crypto currency markets are so volatile and unpredictable.
Due to the losses from these faulty breakouts, its advisable to always set stop losses.
Conclusion
The support and resistance strategy is a very important one in technical analysis. It is applied in all price action techniques, flags, wedges, etc and traders make the most profit during break outs.
There is absolutely no professional trader who jumps into the trading platforms without finding out all support and resistance levels on the chart. This will indicate when to enter the market and where to fix take profit points.
I'm so grateful to Prof. @shemul21 for this wonderful lesson.