Breakouts of supports and resistances - Crypto Academy / S6W3 - Homework post for pelon53

Hello steemians, I would love to join Prof. @pelon53 to welcome each and everyone of us to week three of crypto academy season 6. The topic for the week is Breakouts of supports and resistances and for those who would love to participate, you can do so by reading this link.

Advantages of locating supports and resistances on a chart before trading

This is always the first thing an analyst does once he looks at a price chart. Before we can understand the advantages of locating our support and resistance levels, we need to know what these terms mean.
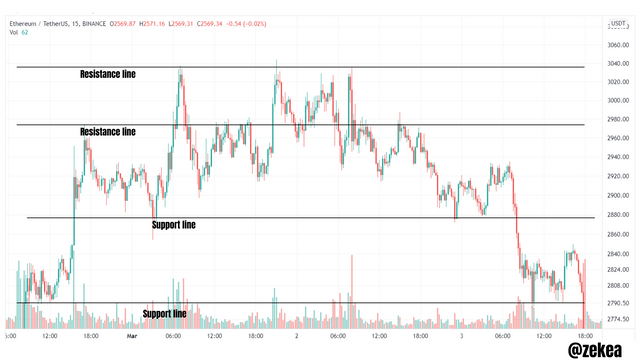
The resistance level as you have seen above is a point on the chart which opposes the price movements downwards. It is the highest price attained on the chart. If you notice the movements of price on the chart above, price shoots up and once it approaches the resistance level, it begins to drop in value. Which means, the market price finds it difficult to surpass that point. This is called the point of resistance and we must note that these levels can be more than one.
The support level is the base point of price. When the market is in a downtrend, once it approaches the support level, it tends to act as an opposing force which pushes the price action upwards. It is usually the lowest point attain by the price action on the chart.
To Identify Reversal Points: Like I said above, the resistance and support levels have an opposing force to price movements. This helps a trader know that when a bullish trend approaches a resistance level, there should be a bearish trend reversal and when a bearish trend approaches the support level, there should be a bullish trend reversal. Traders can use this to make good trades.
To Identify levels to Take Profit: Since we know the levels on the chart where the price action may likely experience a trend reversal, traders can use these levels to place a take profit point when trading. When placing a sell order, a trader can place his take profit point at the support level and hen placing a buy order, a trader can place his take profit at the resistance level.
Affirm Trading decisions: The crypto currency markets are highly volatile and this will make a trader scared and unwilling to make trades but with the support and resistance levels on the chart, this will motivate and help traders with an idea on hen and how to enter the market.
Breakout of Support and Resistance
I f you can recall my explanation of a resistance and support level, there is an opposing force which tries to reverse the direction of price movements in the market. This goes on and on until the support or resistance level gets weak then a breakout is experienced. Breakout is a sudden outburst of the price from the resistance or support level which results in a trend continuation. A breakout on the resistance level causes an bullish trend while a breakout at the support level causes a bearish trend.
Breakout at the resistance
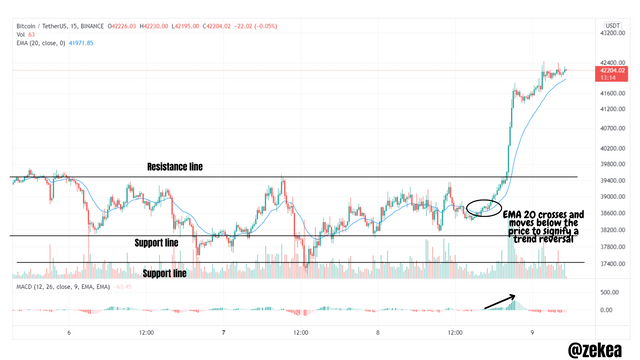
This happened of recent, if you look at the chart above, the price was consolidating below the resistance level but while this was happening, the resistance level was getting weaker. Suddenly, there was a breakout which led to an uptrend.
I used the 20 day Exponential Moving Average and the MAC D to filter the breakout. As you can see in the chart above, the EMA crossed and kept oscillating below the price to confirm an highlight a bullish trend. The Mac D indicator was increasing in magnitude to signify a strong bullish trend.
Note: If the upper side of the mac D indicator was reducing in magnitude this would mean that the breakout was false.
Breakout of Support Level
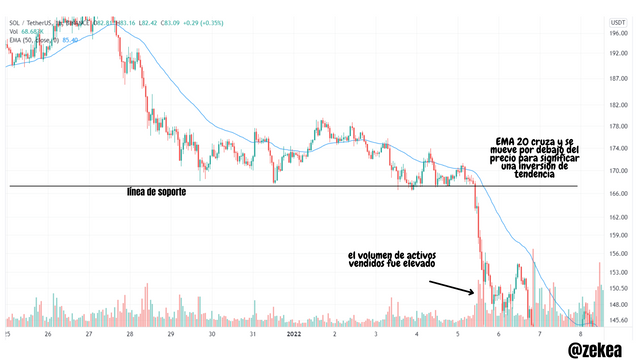
As you can see above, the price broke out from the support level and the market experienced a downtrend. A break at the support level is a sudden outburst of price at the support leading to a bearish trend.
From this chart, I used the EMA 50 and the volume indicator to confirm this break. The EMA crosses and oscillates above the price to signify a bearish trend reversal. Looking at the volume indicator, there was high volume of SOL sold at the time of the breakout. Economically, this will result in a downtrend and since the volume sold were so large it will take the price a long time to recover from such reduction. This will guarantee a strong bearish trend continuation.
False Break
If it was possible to predict every single occurrence on a price chart accurately, there will be no risk of loss and everyone will take trading as a profession. All price action techniques have the tendency to produce faulty or fake signals.
A false break is an occurrence where price breaks out of its resistance or support level but at a point but then it experiences a reverse in trend. What happens here is that the resistance or support level became weaker, with a small increase in volume, price broke out but the bullish or bearish trend was not strong enough, this made the price action to return.
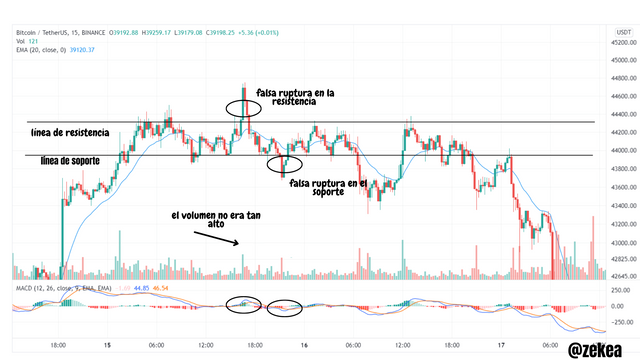
This is an example of false breaks. On the chart, you can see I drew the resistance and support lines. On the resistance line, there was a sudden breakout but the bullish trend was not so strong to continue so the price reversed.
Like I said above, crypto currency projects can be volatile, this makes false breakouts very difficult to filter. Sometimes, we could see a strong breakout and sometimes the trend could reverse. There are still some indicators which can help filter these false breaks. The volume with an addition of the MAC D. For you to filter these faulty breakouts, you need to watch how large the volume was. At the resistance breakout, the volume was not so high and on the next candle, it indicated higher amount of sells and this caused the trend reversal.
The mac D indicator is a histogram which tries to display the strength of trends in the market. Higher green bars signify a strong bullish trend and higher red bars signify a strong bearish trend. On the chart above, the green bars at the resistance breakout were quite short and this signified that the trend may not last. Advise at this point is to watch the market a bit longer to see if the height of the bars will increase before entering your buy position.
With these two indicators, you can try to filter these false signals. Although, I must include that sometimes your analysis may feel correct when trading but the trade didn't just go as planned. This could happen sometimes, so we need be more careful. Include stop losses when trading to reduce your losses.
On a demo account, execute a trade when there is a resistance break, do your analysis. Screenshots required
The did this trade on the ETH/USDT paper trading on Tradingview.
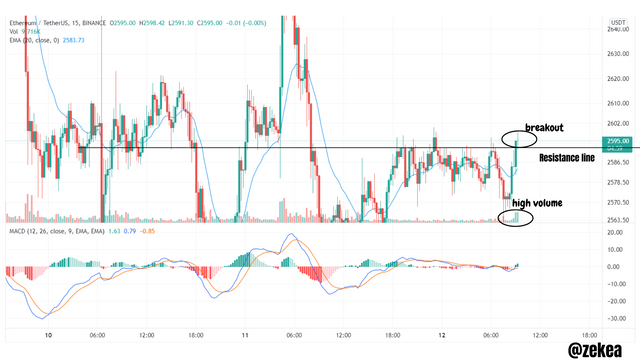
Looking at the chart above, price broke out at the resistance level with a very high trading volume. This confirmed that there will be a bullish trend in the market. I then check the EMA 20 indicator, it was under the price so I placed a buy trade.
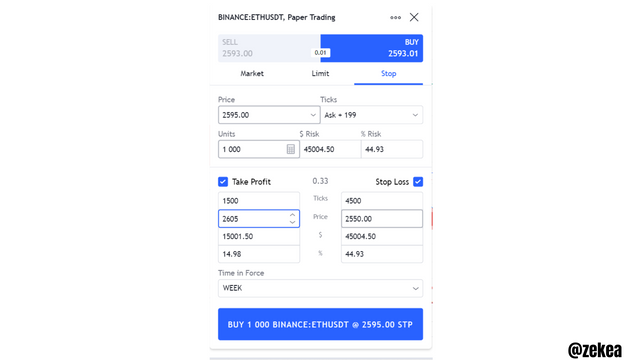
Entry Price: 2595
Take profit: 2605
Stop loss: 2550
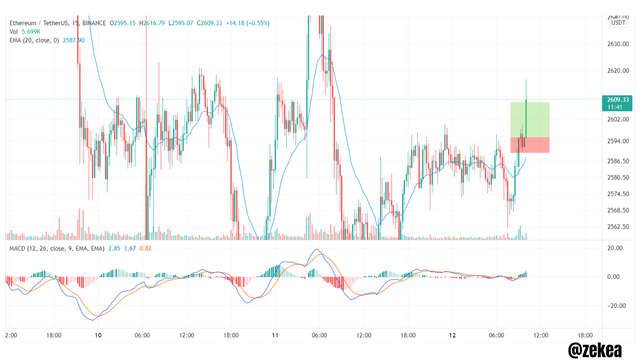
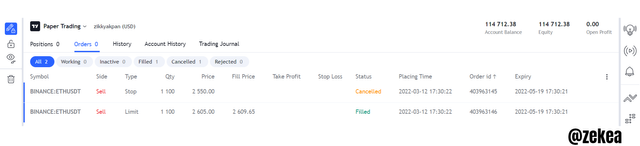
Price surpassed my take profit level, the confirmation of the trade is below
On a demo account, execute a trade when there is a resistance break, do your analysis. Screenshots required
The did this trade on the TRX/USDT paper trading on Tradingview.
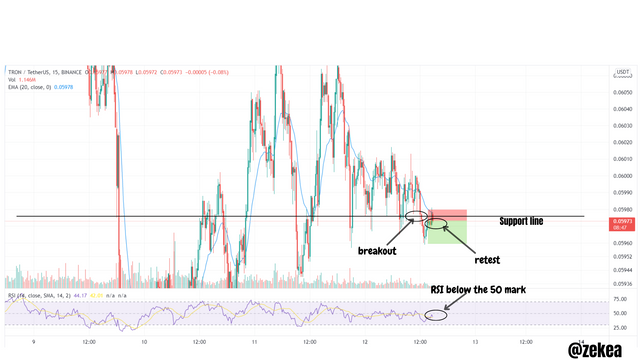
Price broke out at the Support level. Since the volume at that point was not so high, I waited for a retest. Once I saw the retest, I check the EMA 20 indicator, it was above the price so I placed a sell trade.
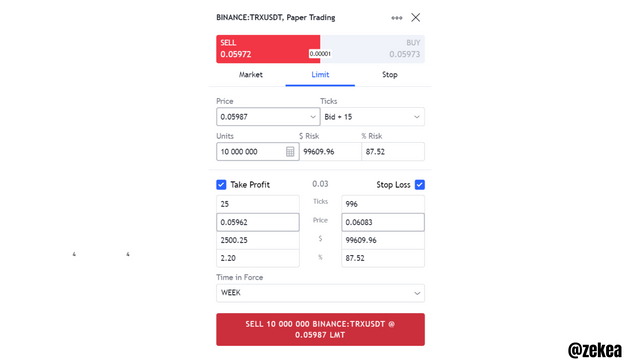
Entry Price: 0.05987
Take profit: 0.05962
Stop loss: 0.06083
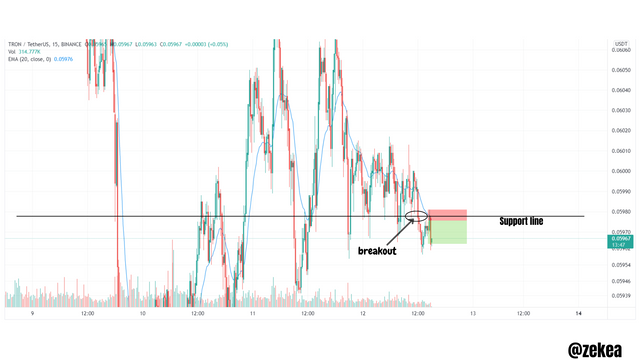
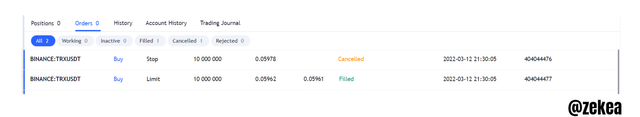
Price surpassed my take profit level, the confirmation of the trade is below
Conclusion
Of all the technical analysis techniques used in trading, the support and resistance analysis is the most used. All professional traders draw out their support and resistance lines first to understand what is going on in the chart. This helps them to set the take profit, entry point and stop loss. Large profits could also be made at breakouts although there is still risks of fake breaks.
This was an interesting lesson and I learnt a lot. I so much thank Prof. @pelon53 for passing down such knowledge.