Welcome to the 8th week of season 5. The season is about to end and I would like to thank
@utsavsaxena11 for teaching this community with valuable trading strategies. Recently, the professor has provided a lecture on the ultimate oscillator indicator and how we can exit and enter considering the signal it provides. I studied the lecture deliberately and answered every question in detail so I hope that you like my homework post.
Ultimate Oscillator Indicator is a renowned technical indicator that was created by Larry Williams which measures the price momentum considering various timeframes. It is similar to the Stochastic Relative Strength Index (RSI) as the plotline moves between 0 and 100. The line below 30 shows that the asset is oversold while the line above 70 represents overbought. This indicator is very famous because it provides fewer signals but those are very accurate. It uses a total of 3 timeframes to produce a signal due to which there’s very little volatility and high accuracy.
Ultimate Oscillator Indicator is very famous among other oscillator indicators as it provides accurate entry and exit signals due to which traders get to make amazing profit with utmost convenience. It helps us to get insight into the divergences and the oversold and overbought state of the asset. I will also show you how it is calculated so that you can find out how it makes use of 3 timeframes to find the result.
This indicator uses the data of 3 timeframes so that much accurate result can be provided that is free from volatility. It is the only reason due to which it provides less signal as compared to other indicators, so it sorts of follow “Quality over Quantity”. However, here’s the formula to calculate this indicator.
UO = [(A7 X 4) + (A14 X 2) + (A28)) / 4+2+1] X 100]
Where;
UO represents ultimate indicator
A7 represents an average of the 7 period
A14 represents average of the 14 period
A28 represents average of the 28 period
Now you might be wondering how these averages are calculated? There’s another formula to find the average of the price that is as follow:
A7 = Sum of the BP (Buying Pressure) of 7 days / Sum of TR (True Range) of the last 7 days
A14 = Sum of the BP (Buying Pressure) of 14 days / Sum of TR (True Range) of the last 14 days
A28 = Sum of the BP (Buying Pressure) of 28 days / Sum of TR (True Range) of the last 28 days
Where;
BP = Closing Price - Minimum Price
TR = Maximum Price - Minimum Price

Question 2
How to identify trends in the market using an ultimate oscillator. What is the difference between an ultimate oscillator and a slow stochastic oscillator?
An ultimate oscillator is also used to identify the trend of the market as we have to observe the line and the overbought and oversold zone. I will show you an example of both cases with a chart pattern so that you can get a better understanding of how this indicator can help you to identify the trend of the market.
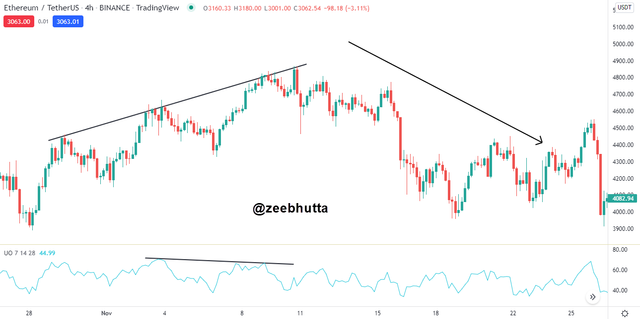
Identifying Downtrend with Ultimate Oscillator Indicator
While identifying the bearish trend with the ultimate oscillator, we have to observe the line and wait for it to pass the 70 which will indicate that the asset is overbought. It represents that price will now retrace and the trend will be changed. I have attached the chart pattern of BTC/USDT which shows that the price started a strong downtrend once the indicator reached the region of 70.

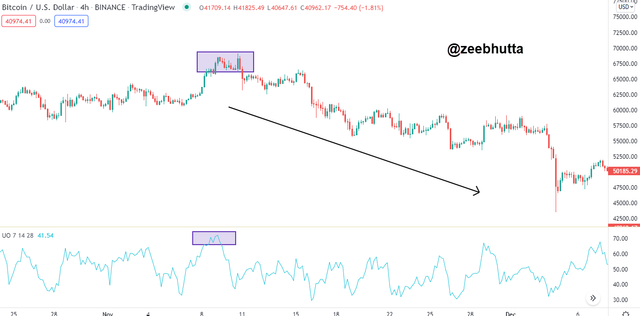
Screenshot Source
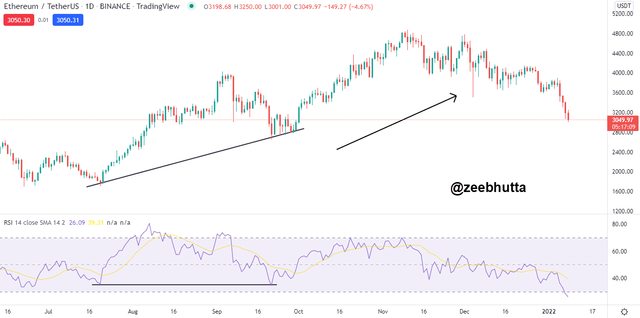
Identifying Uptrend with Ultimate Oscillator Indicator
Finding an uptrend through the ultimate oscillator is the same as finding a downtrend. All you need to wait for the indicator to reach the region of 30 which shows that bears are losing control and the asset is oversold. The attached chart also shows that the indicator touched 30 region and price started a strong uptrend move after that.
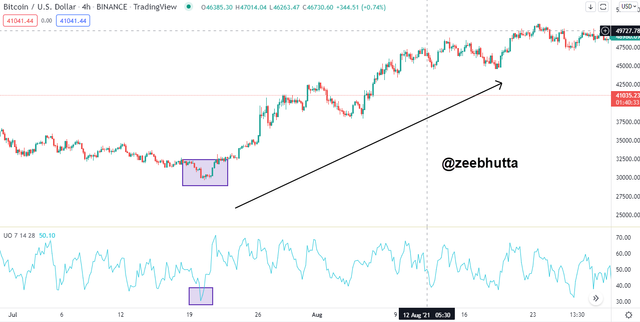
Screenshot Source
Difference Between Ultimate Oscillator and Slow Stochastic Oscillator
There are a few traders that don’t understand the difference between the ultimate oscillator and stochastic oscillator. There are a lot of differences although both look similar. I have mentioned them in the following section for better understanding:
- The first and foremost difference is that the ultimate oscillator uses only 1 line to show the result while the stochastic oscillator uses 2 lines to show the result.
- The stochastic oscillator uses a range of 20 and 100 to show overbought and oversold regions. As for the ultimate oscillator, it uses 30 and 70 respectively.
- The ultimate oscillator produces a less fake signal and while the stochastic oscillator is widely known for producing fake signals.
- The ultimate oscillator makes use of 3 timeframes to provide accurate signals while the stochastic oscillator uses only 2 timeframes.
Question 3:
How to identify divergence in the market using an ultimate oscillator, if we are unable to identify divergence easily then which indicator will help us to identify divergence in the market.
An ultimate oscillator is widely used by traders to find divergences in the asset. I will show you how it is done so that you can make use of it while trading. Let’s start with bullish divergence:
Bullish divergence is formed when the price is making a series of lower lows and lower highs and the ultimate oscillator makes highs. It shows that bulls are taking control of the market and the price can start a bullish rally soon. The same can be seen from the below-mentioned chart that bullish divergence was formed and price changed its trend-right after that.
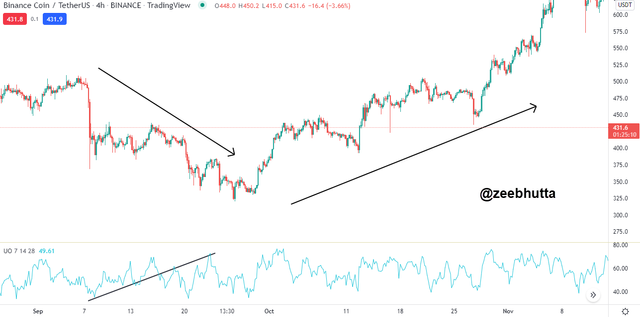
Screenshot Source
Bearish divergence is formed when the price makes a series of higher highs while the ultimate oscillator makes a series of lower lows. It is the sign of bulls losing control of the asset and represents that the ongoing pump won’t last long. You can observe that the price started a strong downtrend move after forming a divergence.
Screenshot Source
Other Indicators for Divergences
I prefer to use RSI which is a famous momentum indicator. It can help a trader to find divergence in the same way as the ultimate oscillator but the difference is that you can find more divergence than the ultimate oscillator. I will show you how you can find divergence by using this indicator.
The attached chart of ETH/USDT shows that the price was making a higher high while the RSI made a higher low. It is called a bullish divergence and the price started a strong bullish trend as indicated by the divergence.
Screenshot Source
Question 4:
what is the 3 step- approach method through which one can make entry and exit from the market. Show real examples of entry and exit from the market.
Professor mentioned in the lecture that there are some criteria of entry and exit while trading using the ultimate oscillator. We will observe the divergence and mark the 30 and 70 regions of the indicator. So, let’s see what is the approach to entry and exit.
MARKET ENTRY – BULLISH TRADE
I have analyzed a 3-hour chart of CRV/USDT which shows everything like divergence and trend. I will discuss more entry criteria in the bullet points.
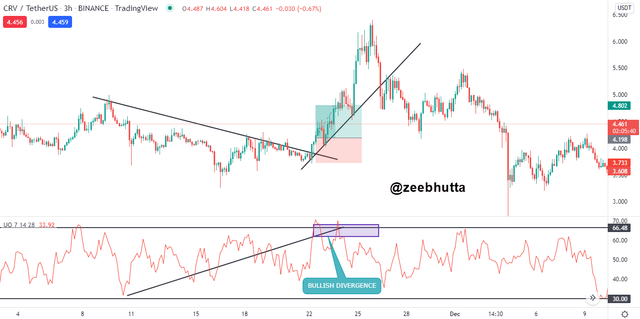
Screenshot Source
The first thing to observe is that the price should be making a series of lower lows and lower highs while the ultimate oscillator should be in an uptrend. So, a perfect bullish divergence can be formed indicating that price is making momentum for a new high.
We have to add much confluence as possible, so we have to make sure that the price touched the oversold zone which is the region of 30. The aforementioned chart shows that the oversold zone was touched by the indicator line.
The last thing is that the ultimate oscillator should touch the overbought zone.
We can simply open a long position when the price of the asset is going down but the ultimate oscillator is about to get close to the overbought zone. So, once the bullish candles start to form, we can open a long position with a preferred risk-reward ratio or wait until the indicator touches the 70 lines of an ultimate oscillator.
MARKET ENTRY – BEARISH TRADE
I will provide an example of sell trade on the MATIC/USDT chart. I have marked the bearish divergence and showed the trend through-line as well. Let’s take a look at the entry criteria:
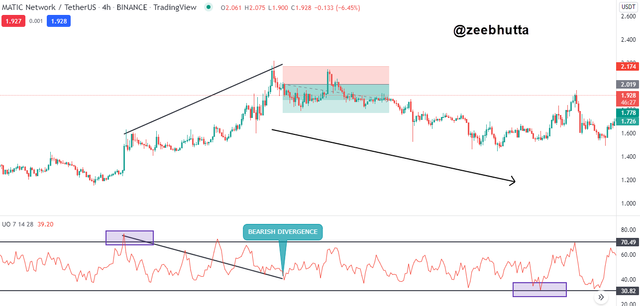
Screenshot Source
The first thing is that price should be making a series of highs and the ultimate oscillator should make a low from the region of 70 which will show a bearish divergence on the chart.
For more confluence, we have to make sure that the ultimate oscillator has touched the overbought zone which will show that the price is about to become bearish.
The last thing to notice is that the ultimate oscillator should touch the oversold zone which is around 30.
We can open a short position once we found out the price is bullish but the ultimate oscillator is near to oversold zone. So, once the bearish candles are formed, we will open the trade with a preferred risk-reward ratio. I have marked RR according to 1:5.
Question 5:
What is your opinion about the ultimate oscillator indicator? Which time frame will you prefer how to use the ultimate oscillator and why?
My personal opinion about the ultimate oscillator is that it is a perfect indicator for those who want to avoid fake signals and trade with accuracy. The reason is that it is known for providing an exceptional signal that can provide huge profit if the buy and sell criteria are followed. One must know how the bullish and bearish divergence is identified otherwise it can be difficult to trade using this indicator. Plus, a trader needs to have a sense of identifying trends through this indicator so that setups can be found using it.
It produces a limited signal which can be considered as a disadvantage but it is better than those indicators that produce a great number of signals but with high risk. However, I believe that it should be used for scalping in smaller timeframes like 1 hour or a few minutes only. It will help you to get maximum signals.
Question 6:
The conclusion is that the ultimate oscillator is one of the best and effective indicators that can be used to find the best entry and exit point. It also shows the trend of the market along with the overbought and oversold zone. So, a trader should know how it works because it can be of great profit to everyone if used properly.

Thanks For Visiting My Post And Your Appreciation
Cc:
@utsavsaxena11