Crypto Academy / S5W7- [Trading Strategy with "Price Action and the Engulfing Candle Pattern"] - Homework Post for @lenonmc21
Designed by @zeebhutta Using Canva

Greeting Everyone,
Welcome to the 7th week of Steemit Crypto Academy where the community is growing together on the crypto field and that’s possible because of the unmatched efforts of professors. I have learned a lot of things about trading strategies, chart patterns, indicators, blockchains, and much more.
Recently, professor @lenonmc21 has provided a lecture on a trading strategy called “Price Action and the Engulfing Candle Pattern”. We will discuss more this strategy through practical and theoretical questions that I have attended in my homework post. I hope you like it and learned the strategy as well.

THEORY
Say in your own words that you understand the Trading Strategy with “Price Action and the Engulfing Candle Pattern, also describe each step to be able to execute it (Place at least 2 examples in clear cryptographic assets and with your charts mandatory)?
Say in your own words that you understand the Trading Strategy with “Price Action and the Engulfing Candle Pattern, also describe each step to be able to execute it (Place at least 2 examples in clear cryptographic assets and with your charts mandatory)?
Professor has provided us with another strategy called “Price Action and the Engulfing Candle Pattern”. It is one of the simplest and profitable strategies that can result in a remarkable success rate and the best thing is that beginner traders can also make use of it to make great bucks.
In this strategy, we use simple price action to identify the trend of the asset like whether it's in an uptrend or downtrend. Once a clear and harmonic trend is identified, we have to observe the price movement for a while until it starts a trend in the opposite direction which will ensure us that the price is about to start trending in opposite direction. When the price starts a new trend, we have to wait for the price to grab the liquidity through engulfing candlestick. Once it has occurred in the chart pattern, that will be our final step indicating that we are all set to open a position in the ongoing direction.
The timeframe matters in this strategy and small ones like 1 hour, 30 minutes, and 15 minutes are recommended. The reason is that we have to observe price action of a high timeframe and make trade on smaller timeframe. So, the bottom line of this strategy is that we have to simply observe a clean and harmonic trend and counter-movement. Next thing is to wait for the engulfing candle that will grab the liquidity which works as an entry point.
For a better understanding, I’m providing a step-by-step guide that will help you to understand this strategy without any confusion.
Step-by-Step Execution of 1st Demo Trade
First Step
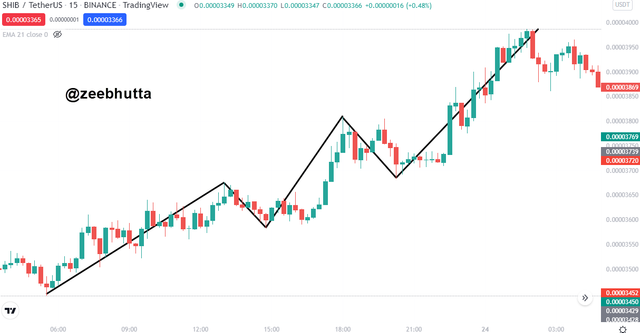
The first step of this strategy is to find a clear and harmonic trend on any asset. If the price is in an uptrend, then it must be making a series of higher highs and higher lows which should look crystal clear. The retracement must not exceed the previous high and the legs should be of equal length to make the trend immaculate. The same goes for the bearish trend but it is to note that this strategy doesn’t work on consolidating the market. So, once the trend is identified, we can deduce that the first step has been completed and we can move to the next.
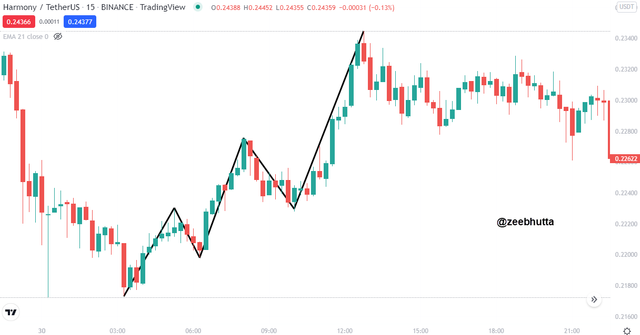
I have marked the perfect example of a harmonic and clear trend in the SHIB/USDT 15 minutes timeframe chart which shows that it is in an uptrend.
Second Step
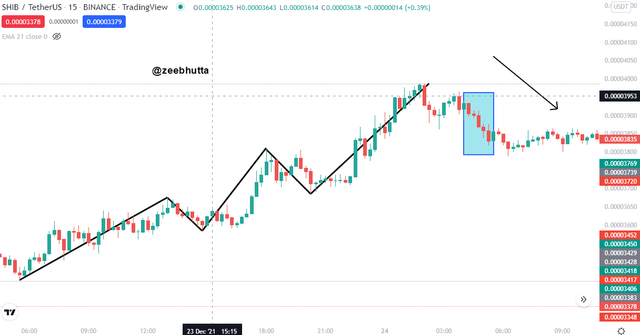
In this step, we have to wait for the price of the asset to move in the complete opposite direction of the prior trend. This will be done through simple price action as we have to observe the candlestick patterns and volume very closely as they will indicate whether the counter-trend is strong enough to sustain it or not. Once it is done, then it means that trend is shifting.
I provided an example of SHIB/USDT in the first step which showed an uptrend, you can see from the below-mentioned chart that I have highlighted a total of 3 bearish candles that was formed with great volume indicating that bears are taking control of the market. So, it is a sign of trend reversal.
Third Step
This is the most important step as we have to wait for the price to commence a strong trend against the ongoing trend. It should be done by breaking the previous high or low to make sure that the price has finally broken the structure and changed its trend. Once the price moves in opposite direction, we have to wait for a break which will be against the ongoing trend.
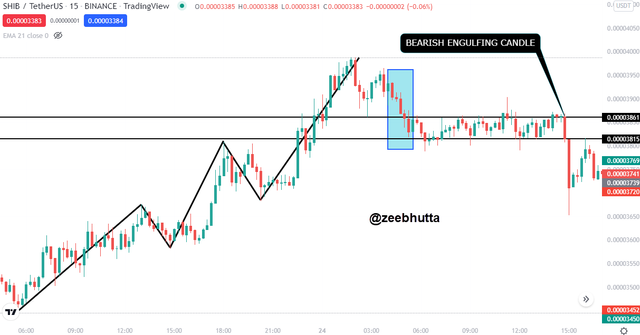
Suppose that the price was bullish but broke the structure and became bearish, then it will take a break by making a minor bullish move. That’s where we will look for an engulfing candle that will cover entire previous candle. After finding the candle, we have to mark 2 horizontal lines on the top and end of the candle body and we can move to the next step after doing so.
You can understand this step much better from the mentioned example. You can see that SHIB/USDT was in an uptrend but a few bearish candles were formed predicting a change in trend. The price took a break by forming a few bullish candles but later made an engulfing candle where I have drawn 2 horizontal lines.
Fourth Step
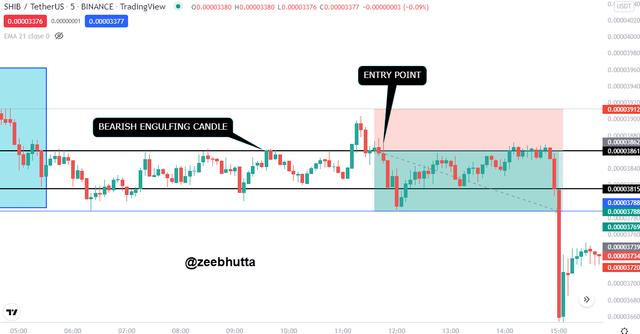
In the final step, we will switch the chart to the smaller time frame and we will look for a clear break of structure area that we marked on higher timeframe through engulfing candlestick. That specific zone would have been already broken in a smaller timeframe so we will simply wait for the pullback but when we see candlestick in the favor of ongoing trend, then we can enter the trade by placing stop loss and take profit according to the support and resistance.
In the SHIB/USDT chart of 5-minute time frame, the price retraces and made a new high and after that formed a series of bearish candles which was my entry point. I placed stop-loss slightly above the retracement candles and take profit was placed in the resistance level which was hit easily.
Execution of 2nd Demo Trade
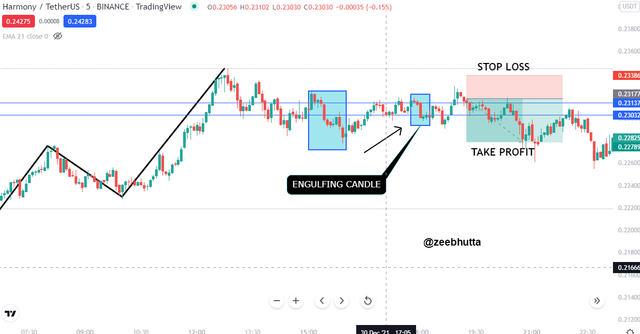
Now I will show you the complete step-by-step execution of 2nd demo trade on the ONE/USDT chart so that the concept can be cleared very well.
1. Have a look at the below-mentioned chart that the price is in a strong and harmonic uptrend by making a high which completes the out first step.
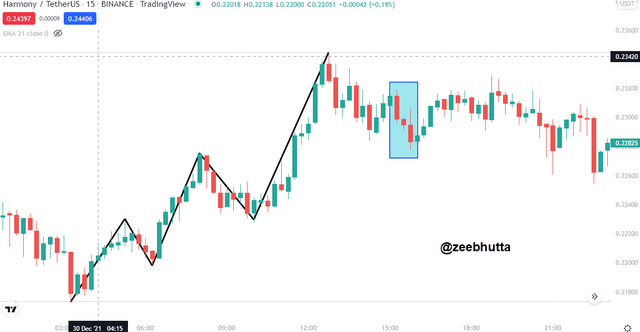
2. The second step is to such candlesticks with great volume that are against the ongoing trend. It will represent the loss in the momentum of the uptrend and indicate the beginning of a bearish trend. I have highlighted those candles.
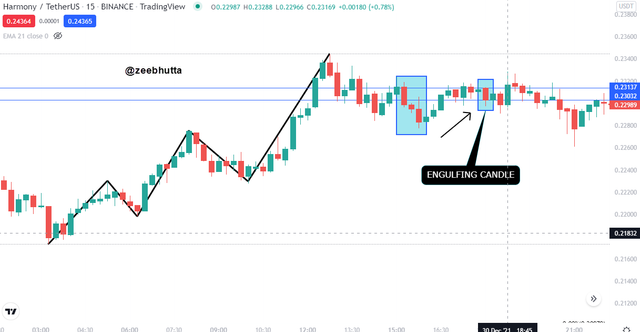
3. In this step, we will look for a break in the price and an engulfing candle. I have marked by an arrow that the price made a bullish retracement and formed an engulfing candle which is highlighted. I also draw 2 horizontal lines on upper and lower side of the candle.
4. I switched to a 5-minute timeframe and observed that the market structure has been already broken and I opened a short position after a price made an impulse wave. Stop-loss was placed above the impulse wave and take profit was placed according to support.
Explain in your own words the interpretation that should be given to a large strong movement in the market. What does the price tell us when it happens?
Explain in your own words the interpretation that should be given to a large strong movement in the market. What does the price tell us when it happens?
When the price is in a complete downtrend and makes a series of high-high and high-low, then we can deduce that the trend is clean and harmonic which is going in a certain direction with ease. However, the market can’t keep going in a certain direction forever. So, there comes a time when a market will always shift its trend. An asset in a downtrend will make a large strong movement by failing to make a new lower-low and forming a higher-high which will surpass the previous low. This shows that the structure is broken and the trend will be changed.
Such strong movement can’t be made the retail investors but the main players are whales who are known for holding a large number of assets. Whales can either be an organization or a large investor. However, a sudden strong change in trend means that whales have put a lot of money against the ongoing trend to hunt the stop loss and grab liquidity which will make it possible for them to grab more assets as the selling price of one person will be the buying price of big players in the market.
Explain the trade entry and exit criteria for the buy and sell positions of the trading strategy with Price Action and Engulfing Candlestick Pattern in any cryptocurrency of your choice (Share your screenshots taking into account a good ratio of risk and benefit)?
Explain the trade entry and exit criteria for the buy and sell positions of the trading strategy with Price Action and Engulfing Candlestick Pattern in any cryptocurrency of your choice (Share your screenshots taking into account a good ratio of risk and benefit)?
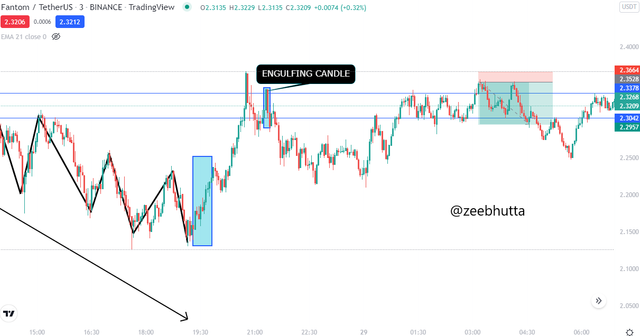
Now I will discuss some of the entry and exit criteria for this strategy so that you can make setups without any mistake. Don’t forget that it is important to follow all of them. Otherwise, the setup won’t be valid.
Screenshot Source
Screenshot Source
Screenshot Source
Screenshot Source
- The first criteria of this strategy are to look for the clean and harmonic trend in the market. The price should be making high or lows with a proper structure and it must be noted that the price should respect it is previous high or low and not exceed them. If the market is volatile and making irregular structures, then it is better to wait for another setup.
- After identifying a strong trend in the market, we have to wait for the price to make a few opposite candles with great volume to confirm that the price is shifting its trend to another direction. Such candles show that the whales are putting money in another direction of the trend and that’s why they are important for this strategy.
- Engulfing candles is an essential part of this trade as it will help in finding an entry point. We have to find it in a 15-minute time frame and mark its body with a horizontal line. In the 5-minute timeframe, we will have to observe a clean breakout and when it is done, the price will make a minor retracement to the previously broken trend. Once done with the retracement, the price will continue the newly begin trend which will be our entry point. So, engulfing candle is a must for this strategy and if it is not formed, then we have to look for another chart.
- The exit criteria are very simple as we put out stop loss above the entry point candle. As for the take profit, it has to be placed according to the support and resistance. If it is not found in the smaller timeframe, then we should open a higher timeframe chart to find the support and resistance so that TP can be placed accordingly.
Screenshot Source
Screenshot Source
Screenshot Source
Screenshot Source
Practice
Make 2 entries (One bullish and one bearish), using the “Price Action and Engulfing Candlestick Pattern” trading strategy. These entries must be made in a demo account, keep in mind that it is not enough to just place the images of the execution, you must place additional images to observe the development of these operations to be able to be correctly evaluated and see if they understood the strategy.
Make 2 entries (One bullish and one bearish), using the “Price Action and Engulfing Candlestick Pattern” trading strategy. These entries must be made in a demo account, keep in mind that it is not enough to just place the images of the execution, you must place additional images to observe the development of these operations to be able to be correctly evaluated and see if they understood the strategy.
Now I will make 2 entries on the demo account through this strategy. My setups will be for both bullish and bearish charts, so it will help you to understand the entry and exit criteria much better.
BEARISH DEMO TRADE
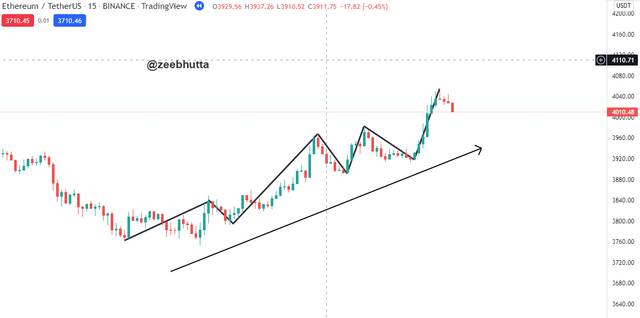
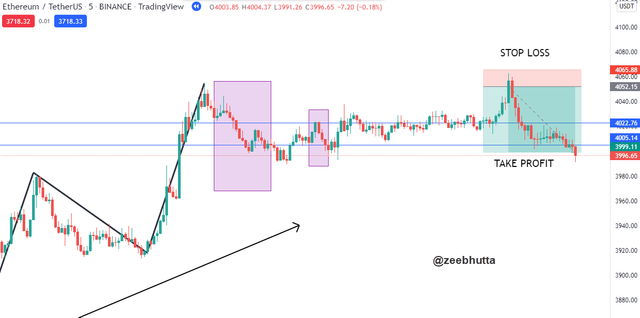
I’m opening a selling trade through this strategy on ETH/USDT chart and I have opted for a 15-minute time frame for technical analysis to find out my entry point. The first thing was to find out the trend and you can see that I have marked the series of highs which shows that the price is in the uptrend.
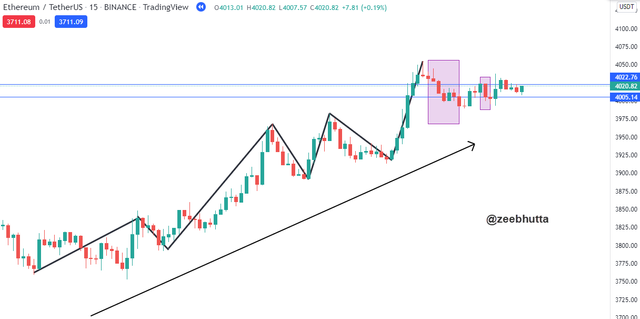
Later the price makes a series of bearish candles with strong volume that the bears are getting in control of the market and the trend can be reversed. The price took a break by making a bullish impulse move but also formed a bearish engulfing candle. I marked the candle's upper and lower body with the horizontal line as shown in the chart.
Now, this is the 5-minute chart which shows that the market structure has been broken and I entered the trade once it made a huge bullish impulse wave and start making red candles. I placed the stop loss above the entry candle and take profit was at the support level.
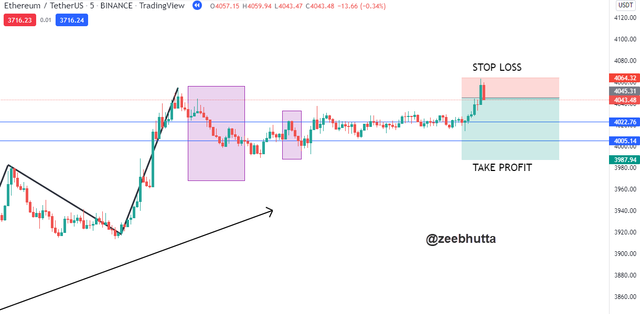
I waited for a few hours and later the TP was hit and here’s the proof of the successful execution of the trade.
BULLISH DEMO TRADE
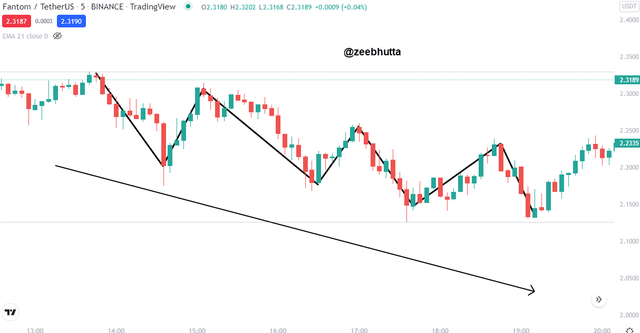
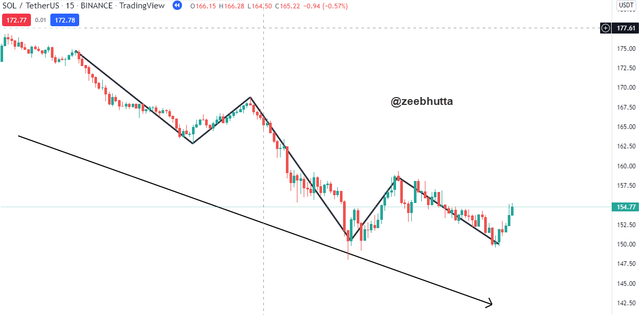
In this setup, I will open a bullish trade using the “Price Action and Engulfing Candlestick Pattern” trading strategy. I have analyzed SOL/USDT chart and marked a series of lows indicating that is in a strong downtrend move.
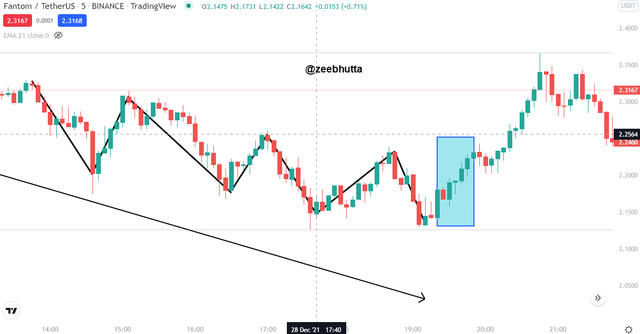
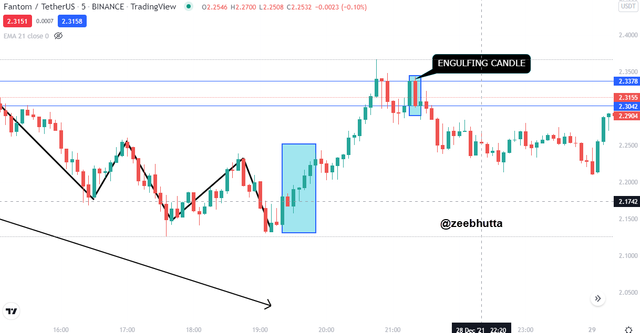
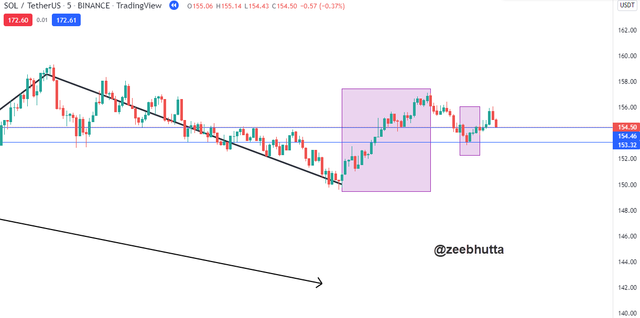
Later, the price made a few bullish candles with high volume which shows that the whales are changing the trend of the asset. After observing more, I noticed that the price took a break by making bearish retracement and forming a bullish engulfing candle. I marked it with 2 horizontal lines and switched to the 5-minute timeframe.
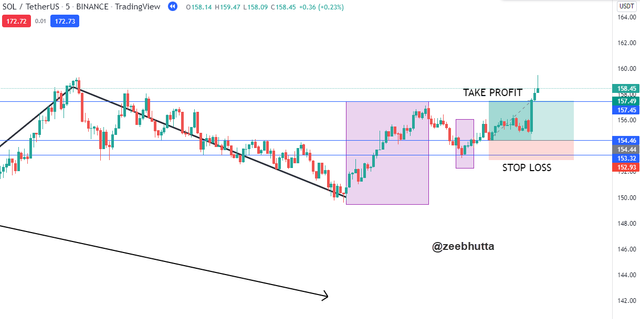
After observing the smaller timeframe, I noticed that the previously bearish market structure was broken and my entry criteria were fully met. So, I opened a long position when the price made a bullish retracement and placed stop loss below the engulfing candle and take profit was in the marked resistance.
The TP was hit and the profit was also booked.
Conclusion
The conclusion is that I have learned a lot of trading strategies, but the “Price Action and the Engulfing Candle Pattern” is one of the most profitable ones as it has a huge success rate. However, it can only provide profit if the entry and exit criteria are followed and that too was deliberately explained by the professor in the lecture. I would like to thank him for teaching us such valuable trading strategies.

Thanks For Visiting My Post And Your Appreciation
Cc:
@lenonmc21

Sort: Trending
Loading...