Crypto Academy / S5W5- [Trading Strategy With The VWAP Indicator] - Homework Post for @lenonmc21


WhatsApp Image 2021-12-17 at 8.23.18 PM.jpeg
Designed by @zeebhutta Using Canva
C3TZR1g81UNaPs7vzNXHueW5ZM76DSHWEY7onmfLxcK2iQMm1KRe2KsZpaQLHDyvnu8HoCxckZYePiSGvWaFNTvHbyziKpKp8aD4UViN7hj21qns4puxfci.png
Greeting Everyone,
Welcome fellow students to my homework post. The professor has taught us about a famous indicator called VWAP and how to trade using it on crypto charts. There are a lot of things to consider while using this indicator and I will be sharing everything by answering required questions deliberately.

4i88GgaV8qiFU89taP2MgKXzwntUGAvkoQiKU7VxyD37q9CW5q3pdqiJWDAExHdLuxAma4HGwMGfg4z3E9GeHvGZ8NQycGAydY3z3bXkFe1HmFVf9DqfHz5r4d.gif

THEORY

4i88GgaV8qiFU89taP2MgKXzwntUGAvkoQiKU7VxyD37q9CW5q3pdqiJWDAExHdLuxAma4HGwMGfg4z3E9GeHvGZ8NQycGAydY3z3bXkFe1HmFVf9DqfHz5r4d.gif

Explain and define in your own words what the “VWAP” indicator is and how it is calculated (Nothing taken from the internet)?

There are several technical indicators in the market that are widely used by traders but VWAP is distinguished from all of them because it is has some unique features that I will explain. VWAP stands for Volume Weighted Average Price. What makes it unique is that this indicator considers the value of the asset traded in a day and the total volume of the transaction while no other indicator uses such elements.

The majority of technical indicators use past data of the asset to calculate the result but that’s not the case with VWAP as it uses the present data due to which we can find many profitable signals by using it. VWAP also works as support and resistance. Plus, be it any time frame like 5 minutes or 4 hours, it provides the same output which is a remarkable feature. It is very helpful because it sets the bias of traders.

Now that you have understood the applications of VWAP, I will show you how it is calculated so that you can know on what basis it provides the result.

All we need is 3 things that are as follow:

Price of asset traded throughout the period - P The volume of assets traded throughout the period - V Number of candles throughout the period – N

Once all these things are gathered, we have to calculate the result through the following formula:

VWAP = (P+V)/N

That’s how you VWAP plot the result on the chart of any asset.

4i88GgaV8qiFU89taP2MgKXzwntUGAvkoQiKU7VxyD37q9CW5q3pdqiJWDAExHdLuxAma4HGwMGfg4z3E9GeHvGZ8NQycGAydY3z3bXkFe1HmFVf9DqfHz5r4d.gif

Explain in your own words how the “Strategy with the VWAP indicator should be applied correctly (Show at least 2 examples of possible inputs with the indicator, only own charts)?

Now I will show you how to apply the VWAP indicator on the crypto chart so that we can start trading using it. However, we will be using a custom setting as taught by the professor as it works better with this indicator. The procedure is quite easy as I will explain everything in a simple step-by-step manner on tradingview for better understanding.
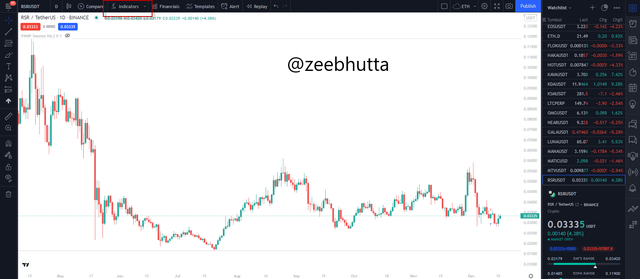
  1. The first step is to open any chart pattern of crypto and click on the “INDICATOR” on the top bar that I have highlighted.
  2. C3TZR1g81UNaPs7vzNXHueW5ZM76DSHWEY7onmfLxcK2iQMm1KRe2KsZpaQLHDyvnu8HoCxckZYePiSGvWaFNTvHbyziKpKp8aD4UViN7hj21qns4puxfci.png
    1.png
    Screenshot Source
    C3TZR1g81UNaPs7vzNXHueW5ZM76DSHWEY7onmfLxcK2iQMm1KRe2KsZpaQLHDyvnu8HoCxckZYePiSGvWaFNTvHbyziKpKp8aD4UViN7hj21qns4puxfci.png

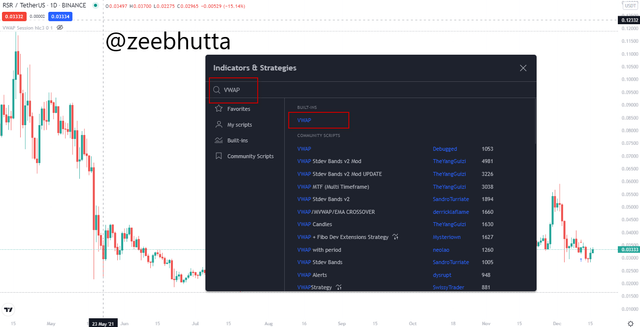
  3. Once clicked, write “VWAP” on the search bar and it will show you the indicator and you have to click on it to apply the indicator on the chart.
  4. C3TZR1g81UNaPs7vzNXHueW5ZM76DSHWEY7onmfLxcK2iQMm1KRe2KsZpaQLHDyvnu8HoCxckZYePiSGvWaFNTvHbyziKpKp8aD4UViN7hj21qns4puxfci.png
    2.png
    Screenshot Source
    C3TZR1g81UNaPs7vzNXHueW5ZM76DSHWEY7onmfLxcK2iQMm1KRe2KsZpaQLHDyvnu8HoCxckZYePiSGvWaFNTvHbyziKpKp8aD4UViN7hj21qns4puxfci.png

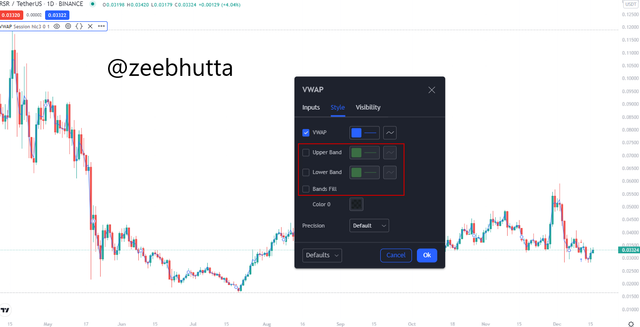
  5. The VWAP will be applied on the chart but we have to remove the upper band, lower band, and band fill from the settings. I have marked them on the mentioned image. I will increase the thickness and change the color to black for better representation.
  6. C3TZR1g81UNaPs7vzNXHueW5ZM76DSHWEY7onmfLxcK2iQMm1KRe2KsZpaQLHDyvnu8HoCxckZYePiSGvWaFNTvHbyziKpKp8aD4UViN7hj21qns4puxfci.png
    3.png
    Screenshot Source
    C3TZR1g81UNaPs7vzNXHueW5ZM76DSHWEY7onmfLxcK2iQMm1KRe2KsZpaQLHDyvnu8HoCxckZYePiSGvWaFNTvHbyziKpKp8aD4UViN7hj21qns4puxfci.png

  7. That’s how easy it is to apply the VWAP on the chart.
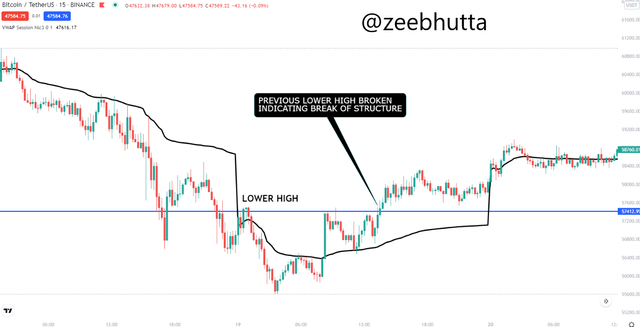
C3TZR1g81UNaPs7vzNXHueW5ZM76DSHWEY7onmfLxcK2iQMm1KRe2KsZpaQLHDyvnu8HoCxckZYePiSGvWaFNTvHbyziKpKp8aD4UViN7hj21qns4puxfci.png
4.png
Screenshot Source
C3TZR1g81UNaPs7vzNXHueW5ZM76DSHWEY7onmfLxcK2iQMm1KRe2KsZpaQLHDyvnu8HoCxckZYePiSGvWaFNTvHbyziKpKp8aD4UViN7hj21qns4puxfci.png

Once the VWAP has been successfully applied to the chart, now it’s time to understand how the strategy is applied so that you can find the perfect signal because any mistake in this process can have serious consequences. There are only 3 steps that I will explain in the simplest way.

4i88GgaV8qiFU89taP2MgKXzwntUGAvkoQiKU7VxyD37q9CW5q3pdqiJWDAExHdLuxAma4HGwMGfg4z3E9GeHvGZ8NQycGAydY3z3bXkFe1HmFVf9DqfHz5r4d.gif

Break of Structure

The foremost step is to find the break of structure in the price of the market. If the asset is in an uptrend, then it has to break the previous higher-low along with the VWAP line. As for the break of the bearish market, the price must break the previous lower-high including the VWAP line. Once you identify the breakout in the market, we have to move to the second step.

C3TZR1g81UNaPs7vzNXHueW5ZM76DSHWEY7onmfLxcK2iQMm1KRe2KsZpaQLHDyvnu8HoCxckZYePiSGvWaFNTvHbyziKpKp8aD4UViN7hj21qns4puxfci.png
5.png
Screenshot Source
C3TZR1g81UNaPs7vzNXHueW5ZM76DSHWEY7onmfLxcK2iQMm1KRe2KsZpaQLHDyvnu8HoCxckZYePiSGvWaFNTvHbyziKpKp8aD4UViN7hj21qns4puxfci.png

Applying Fibonacci Retracement

The next step is to apply the Fibonacci retracement from the first impulse to the last one. It helps us to find the potential entry point along with the exit point. You can observe from the below-mentioned chart that the price broke the previous high, so I applied retracement from the lowest impulse point to the highest one.

We have to pay attention to the golden ratio that is 50% and 61.8% because the price can bounce from that area due to which we can enter at that point.

C3TZR1g81UNaPs7vzNXHueW5ZM76DSHWEY7onmfLxcK2iQMm1KRe2KsZpaQLHDyvnu8HoCxckZYePiSGvWaFNTvHbyziKpKp8aD4UViN7hj21qns4puxfci.png
6.png
Screenshot Source
C3TZR1g81UNaPs7vzNXHueW5ZM76DSHWEY7onmfLxcK2iQMm1KRe2KsZpaQLHDyvnu8HoCxckZYePiSGvWaFNTvHbyziKpKp8aD4UViN7hj21qns4puxfci.png

Trade Management

Once we have made entry using the Fibonacci retracement, we have to manage the trade by marking TP and stop loss. It has been explained by the professor that stop loss should be placed below the 50% or 61.8% because it’s a strong support zone. However, the TP is 1.5x more than stop loss so that we can get the risk to reward ratio of 1.5 or more.

C3TZR1g81UNaPs7vzNXHueW5ZM76DSHWEY7onmfLxcK2iQMm1KRe2KsZpaQLHDyvnu8HoCxckZYePiSGvWaFNTvHbyziKpKp8aD4UViN7hj21qns4puxfci.png
7.png
Screenshot Source
C3TZR1g81UNaPs7vzNXHueW5ZM76DSHWEY7onmfLxcK2iQMm1KRe2KsZpaQLHDyvnu8HoCxckZYePiSGvWaFNTvHbyziKpKp8aD4UViN7hj21qns4puxfci.png

Explain in detail the trade entry and exit criteria to take into account to correctly apply the strategy with the VWAP indicator?

While opening a position using this strategy, there are some elements that we have to consider at all costs to gain maximum profits. Not doing so can result in harming the funds because the entry and exit point won’t be accurate. I will explain the criteria in great depth so that you can know all about them.
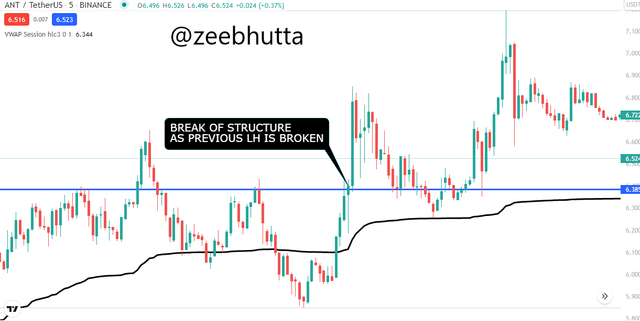
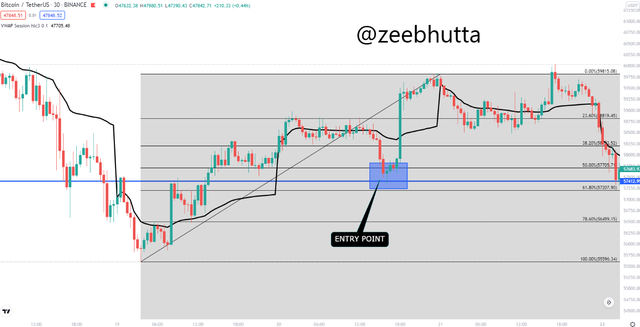
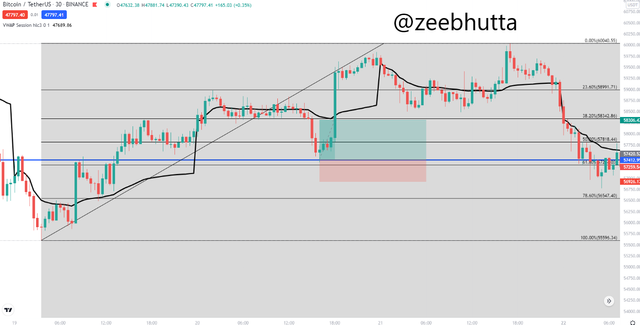
  • We have to be sure about the break of the market structure and VWAP so that we can enter the trade. It shouldn’t be a breakout but a complete change of structure with great volume so that the first criteria can be met. So, the bottom line is that the previous high or low must be broken for trend reversal.

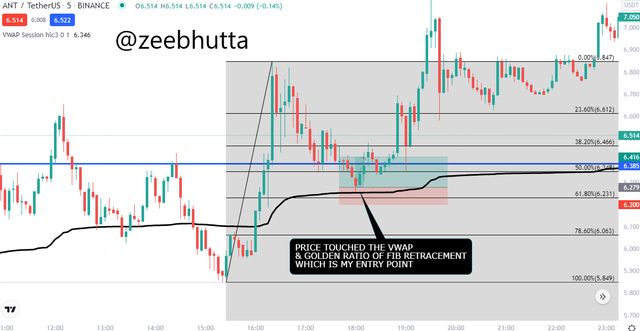
  • Once the market structure is broken, we have to wait for the price to retrace back and touch the VWAP along with the golden ratio of a Fibonacci retracement so that we can enter the trade. If it doesn’t retrace to our target point, then we have to consider it invalid.

  • Risk management is very important for every trader due to which stop loss must be placed below the 50% or 61.8% of Fibonacci retracement.

  • The risk to reward ratio should be around 1:5 or 1:2.
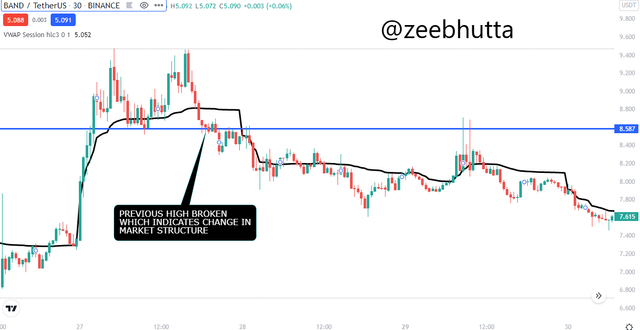
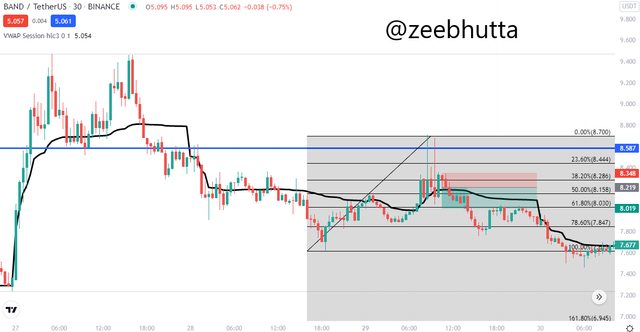

    4i88GgaV8qiFU89taP2MgKXzwntUGAvkoQiKU7VxyD37q9CW5q3pdqiJWDAExHdLuxAma4HGwMGfg4z3E9GeHvGZ8NQycGAydY3z3bXkFe1HmFVf9DqfHz5r4d.gif

    PRACTICAL

    4i88GgaV8qiFU89taP2MgKXzwntUGAvkoQiKU7VxyD37q9CW5q3pdqiJWDAExHdLuxAma4HGwMGfg4z3E9GeHvGZ8NQycGAydY3z3bXkFe1HmFVf9DqfHz5r4d.gif

    Make 2 entries (One bullish and one bearish), using the strategy with the “VWAP” indicator. These entries must be made in a demo account, keep in mind that it is not enough just to place the images of the entry, you must place additional images to observe their development in order to be correctly evaluated.

    Bullish Demo Trade

    In order to show you a bullish example of the VWAP strategy, I have used a chart of ANT/USDT. The price was in a complete downtrend but the price broke the previous low along with the VWAP line which is the sign of a break of market structure. So, the first criteria were fully met.

    C3TZR1g81UNaPs7vzNXHueW5ZM76DSHWEY7onmfLxcK2iQMm1KRe2KsZpaQLHDyvnu8HoCxckZYePiSGvWaFNTvHbyziKpKp8aD4UViN7hj21qns4puxfci.png
    8.png
    Screenshot Source
    C3TZR1g81UNaPs7vzNXHueW5ZM76DSHWEY7onmfLxcK2iQMm1KRe2KsZpaQLHDyvnu8HoCxckZYePiSGvWaFNTvHbyziKpKp8aD4UViN7hj21qns4puxfci.png

    The next thing is to apply the Fibonacci retracement so that I can enter the trade when the price retraces between the golden ratio. The price successfully came to my entry point and I opened a long position by placing a stop loss below 61.8% while the TP was according to the RR of 1:5.

    C3TZR1g81UNaPs7vzNXHueW5ZM76DSHWEY7onmfLxcK2iQMm1KRe2KsZpaQLHDyvnu8HoCxckZYePiSGvWaFNTvHbyziKpKp8aD4UViN7hj21qns4puxfci.png
    9.png
    Screenshot Source
    C3TZR1g81UNaPs7vzNXHueW5ZM76DSHWEY7onmfLxcK2iQMm1KRe2KsZpaQLHDyvnu8HoCxckZYePiSGvWaFNTvHbyziKpKp8aD4UViN7hj21qns4puxfci.png

    You can see that price is bullish which means the prediction was perfect and the price easily hit the TP.

    4i88GgaV8qiFU89taP2MgKXzwntUGAvkoQiKU7VxyD37q9CW5q3pdqiJWDAExHdLuxAma4HGwMGfg4z3E9GeHvGZ8NQycGAydY3z3bXkFe1HmFVf9DqfHz5r4d.gif

    Bearish Demo Trade

    Now I will represent a bearish example of this strategy on the chart of BAND/USDT. Observe that price was making a series of high but it broke the previous high which is the sign of break of market structure. So, our first criteria were fully met and we can move to the next step.

    C3TZR1g81UNaPs7vzNXHueW5ZM76DSHWEY7onmfLxcK2iQMm1KRe2KsZpaQLHDyvnu8HoCxckZYePiSGvWaFNTvHbyziKpKp8aD4UViN7hj21qns4puxfci.png
    10.png
    Screenshot Source
    C3TZR1g81UNaPs7vzNXHueW5ZM76DSHWEY7onmfLxcK2iQMm1KRe2KsZpaQLHDyvnu8HoCxckZYePiSGvWaFNTvHbyziKpKp8aD4UViN7hj21qns4puxfci.png

    I applied a Fibonacci retracement on an impulse move of the price and waited for the price to come between the golden ratio. Once it did, I entered the trade and shorted the asset with a risk to return ratio of 1:5 while the stop loss was above 61.8%.

    C3TZR1g81UNaPs7vzNXHueW5ZM76DSHWEY7onmfLxcK2iQMm1KRe2KsZpaQLHDyvnu8HoCxckZYePiSGvWaFNTvHbyziKpKp8aD4UViN7hj21qns4puxfci.png
    11.png
    Screenshot Source
    C3TZR1g81UNaPs7vzNXHueW5ZM76DSHWEY7onmfLxcK2iQMm1KRe2KsZpaQLHDyvnu8HoCxckZYePiSGvWaFNTvHbyziKpKp8aD4UViN7hj21qns4puxfci.png

    You can see that the price was bearish which makes my trade valid.

    4i88GgaV8qiFU89taP2MgKXzwntUGAvkoQiKU7VxyD37q9CW5q3pdqiJWDAExHdLuxAma4HGwMGfg4z3E9GeHvGZ8NQycGAydY3z3bXkFe1HmFVf9DqfHz5r4d.gif

    Conclusion

    The conclusion of this homework is that VWAP is one of the best indicators that can provide great signals based on the present data of the asset. Plus, the strategy provided by the professor can give us huge profit if the criteria are fully met.

    qjrE4yyfw5pEPvDbJDzhdNXM7mjt1tbr2kM3X28F6SraZdKzByGAYdtt1XATaczwhH9gQq7vEfKiNortStnHAisofkdee6c64Phv3JgwfuYMxYLci8obrpP8.png

    Thanks For Visiting My Post And Your Appreciation

    Cc:
    @lenonmc21

    1637074190054.png

Sort:  
Loading...

Coin Marketplace

STEEM 0.24
TRX 0.11
JST 0.031
BTC 60936.15
ETH 2921.43
USDT 1.00
SBD 3.70