Crypto Academy / Season 3 / Week 4 - Homework Post for @reminiscence01 (Candlestick Patterns)
Hello All...
Today I will try to join the class of professor @reminiscence01, about Candlestick Patterns. This is a very interesting class. well, I will do the homework by answering some of the questions given.
.jpg)
Background from canva

In your own words, explain the psychology behind the formation of the following candlestick patterns.
Bullish Engulfing Candlestick Pattern
Bullish engulfing candlestick is a pattern on a candlestick that occurs when a price reversal occurs. so this pattern occurs when the reversal of a bearish trend becomes a bullish trend. This is a strong reversal pattern caused by the overwhelming dominance of buyers at the time this pattern was formed. For more details, we can see its characteristics from the image below.
 source
Bullish Engulfing Candlestick Pattern
From the picture above, we can see the characteristics of the bullish engulfing candlestick pattern are:
A bearish candlestick marked in green changes to a bullish candlestick marked in red.
The bullish candlestick is bigger than the bearish candlestick
Doji Candlestick Pattern
The Doji candlestick pattern is a pattern on a candlestick that occurs when there is doubt in the market. so this pattern occurs when both buyers and sellers do not dominate the market. so when this candlestick is formed it is a highly recommended pattern to enter a trade, if this pattern is formed traders should wait for the next pattern to enter the market. For more details, we can see the characteristics of this pattern as shown below.
 source
Doji Candlestick Pattern
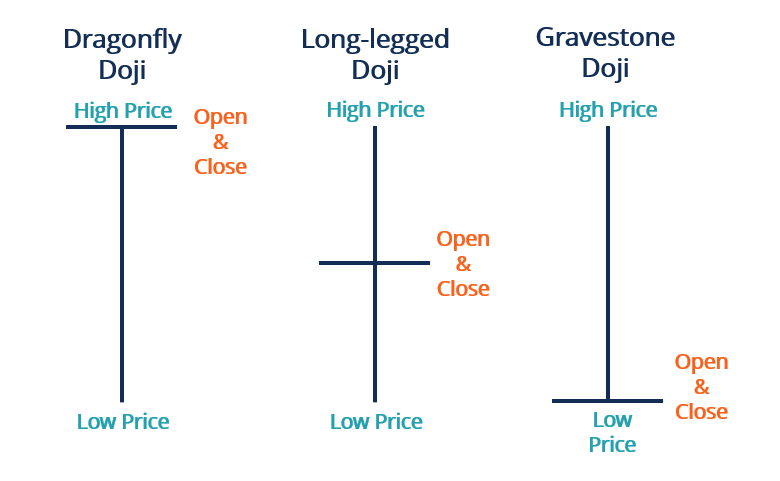
from the picture above we can see the characteristics of the Doji candlestick pattern are:
Doji candlesticks look like horizontal and vertical lines only.
On the Doji candlestick the closing and opening prices are the same, therefore no candlestick body is formed
The Hammer Candlestick Pattern
The hammer candlestick pattern is a pattern that appears because there is a very strong rejection from buyers of cryptocurrency assets on the market. This pattern is usually caused by buyers dominating the market so quickly that the candlestick is shaped like a hammer. Usually, this pattern is formed at the support level which indicates a trend reversal will occur from bearish to bullish
The inverted hammer candlestick pattern is the opposite of the hammer candlestick. This pattern is usually caused by sellers dominating the market so quickly that it takes the form of an inverted hammer. Usually, this pattern is formed at the resistance level, indicating a trend reversal from bullish to bearish. To get to know the shape of this pattern, we can see the image below.
 source
The Hammer and Inverted Hammer Candlestick Pattern
From the picture above, we can see that the characteristics of hammer and inverted hammer candlesticks are:
The candlestick is shaped like a hammer and has a long tail.
The candlestick body is not very big so the closing and opening prices are very close.
The Morning and Evening Star Candlestick Pattern.
The morning star candlestick pattern is a pattern that occurs when the seller who dominates the market is suddenly taken over by the buyer and the seller is unable to push the price lower, then the buyer immediately takes over to dominate the market. This pattern usually occurs at support levels. To know more about this candlestick pattern, we can see the image below.
 source
The Morning Star Candlestick Pattern
From the picture above, we can see that the characteristics of the morning star candlestick are:
Candlestick shaped like an inverted triangle
The candlestick consists of a large bearish candle, a small Doji candlestick, and a large bullish candlestick.
The evening star candlestick pattern is a pattern that occurs when the more dominant buyers in the market are suddenly taken over by the sellers and the buyers are unable to push the price higher, then the sellers immediately take over to dominate the market. This pattern usually occurs at resistance levels. To know more about this candlestick pattern, we can see the image below.
 source
The Evening Star Candlestick Pattern
From the picture above, we can see that the characteristics of the evening star candlestick are:
Candlestick shaped like a triangle
The candlestick consists of a large bullish candle, a small Doji candlestick, and a large bearish candlestick.
Identify these candlestick patterns listed in question one on any cryptocurrency pair chart and explain how price reacted after the formation. (Screenshot your own chart for this exercise)
Bullish Engulfing Candlestick Pattern

Screenshoot from tradingview
Bullish Engulfing Candlestick Pattern (TRX/USD)
We can see from the chart above as I have indicated that when a bullish engulfing pattern occurs, the price reverses direction from a downtrend pattern to an uptrend pattern. This pattern occurs due to the activity of buyers who are more dominant than sellers. so at that time, the buyer is controlling the market which causes the price of an asset to continue to increase. this is a good time to enter the market.
Doji Candlestick Pattern

Screenshoot from tradingview
Doji Candlestick Pattern (TRX/USD)
We can see from the chart above as I have indicated that when the Doji Candlestick pattern occurs, it is when there is doubt in the market, no one dominates the market when this pattern occurs, so when this pattern is formed it is recommended to observe the market first and wait the next pattern is formed to get the right time to enter the market
The Hammer Candlestick Pattern

Screenshoot from tradingview
The Hammer Candlestick Pattern (TRX/USD)
We can see from the chart above as I have indicated that when the hammer candlestick pattern occurs, there is a change in the candlestick pattern here because the seller is unable to suppress the price, so buyers dominate here and immediately press the price because this pattern is at the support level and is immediately dominated by buyers very quickly.
The Inverted Hammer Candlestick Pattern

Screenshoot from tradingview
The Inverted Hammer Candlestick Pattern (TRX/USD)
We can see from the chart above as I have marked that when the Inverted hammer candlestick pattern occurs, here there is a change in the candlestick pattern because the buyer is unable to suppress the price, so the seller dominates here and immediately presses the price, if this pattern is formed, it will most likely happen a downtrend because this pattern is at the resistance level and is immediately dominated by sellers very quickly. this is a good time to sell our assets to make a profit.
The Morning Star Candlestick Pattern.

Screenshoot from tradingview
The Morning Star Candlestick Pattern (TRX/USD)
From the candlestick chart above, when the morning star candlestick is formed, then at that time the seller is controlling the price in the market then the seller's dominance begins to decline and is replaced by buyers who control the price in the market, it can be said that when the bearish phase changes to bullish, then when this pattern is formed it is highly recommended for traders to enter on the trade.
The Evening Star Candlestick Pattern.

Screenshoot from tradingview
The Evening Star Candlestick Pattern (TRX/USD)
from the candlestick chart above, when the evening star candlestick is formed, then at that time, the buyer is controlling the price in the market then the buyer's dominance begins to decline and is replaced by the seller who controls the price in the market to take profits, you can say this is when the bullish phase changes to bearish, so when this pattern is formed it is highly recommended for traders to exit the trade to take profits.
Using a demo account, open a trade using any of the Candlestick patterns on any cryptocurrency pair. You can use a lower timeframe for this exercise. (Screenshot your own chart for this exercise).
so on this occasion, I will try to use my Upbit account. As for the currency pair I chose BTC/IDR well, let's take a look at the chart below.

Bullish Engulfing Pattern (BTC/IDR)
in the picture above we can see that I was trying to enter a trade when the chart was forming a bullish engulfing pattern, so when this pattern has formed the chance of an uptrend is very large, because when this pattern is formed the buyers are more dominant and the price is expected to increase.
so I tried to buy BTC for 40,000 IDR and I got 0.00008558 BTC when the bullish engulfing pattern formed. like the picture below.
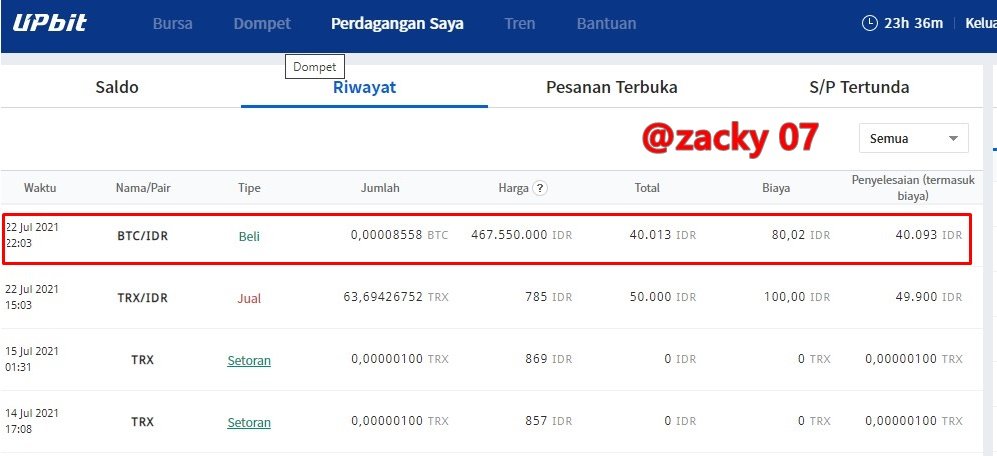 Transaction history (BTC/IDR)
Conclusion
For a trader to carry out technical analysis, reading candlestick patterns is very necessary when entering a trade. candlestick pattern is formed from the activity of sellers and buyers. so by understanding the psychology of the market traders can make the right decision to enter the market. this all requires experience and understanding of the pattern that occurs, if you understand the formation of the pattern, then the opportunity to predict the pattern that will be formed is even greater.
Thank you for reading my homework
CC: @reminiscence01