Steemit Crypto Academy-Temporada 2 semana 8/El Método de Wyckoff por @yri02

Good day to all the students of this community and to the teacher @fendit for the conference given for each of us, where she explained in detail about the Wyckoff method, its theory, fundamental laws, compound man and its respective phases and the steps to apply this method to get into the subject I will explain it in my own words:
This method was developed by Richard Wyckoff in 1920, it deals with a system where he explains to us how are the phases through which the market passes, likewise this helps us to predict movements, future prices of assets or shares and How to generate profits with each of them in the long term, investing in the various stock exchanges, there are phases in the market that help us position ourselves in terms of purchase and investment of assets, now I will answer the questions raised
- Share what you have understood about "Composite Man" and the fundamental laws. What is your point of view on this?
This man does not exist within the market, he is only as an image that we will make ourselves to carry out our negotiations, he is the one that will keep us informed of everything that happens within the market, that is, the different movements that in one way or another can affect or benefit investors. This is like an imaginary operator, which helps us study the stock market as if it were controlled by it.
Lo cual les facilita a los inversores las tendencias, acumulación, distribución y otros aspectos que presenta el mercado. En esencia un hombre compuesto es el que representa principalmente al creador del mercado, presentándolo como personas muy adineradas actuando de la manera correcta para asegurar a los inversores de que puedan comprar barato o vender caro. Esta estrategia es utilizada por la mayoría de los inversionistas para poder predecir los precios y demás aspectos que presentan los activos, y para que los inversores aprendan con este método a utilizar y realizar negocios sin llegar a la quiebra, lo mismos quieren es obtener ganancias a futuro.
Which provides investors with trends, accumulation, distribution and other aspects that the market presents. In essence a composite man is one who primarily represents the market maker, presenting him as very wealthy people acting in the right way to assure investors that they can buy low or sell high. This strategy is used by most investors to be able to predict prices and other aspects of assets, and for investors to learn with this method to use and conduct business without going bankrupt, the same thing they want is to obtain profits through future.
Some Characteristics of the Composite Man:
¶ Determine where the market is currently and project each of its trends.
¶ Identify assets so that you are going along with trends so investors can analyze what they are doing.
¶ Assist investors in making asset purchases and sales.
Within the Phases we have:
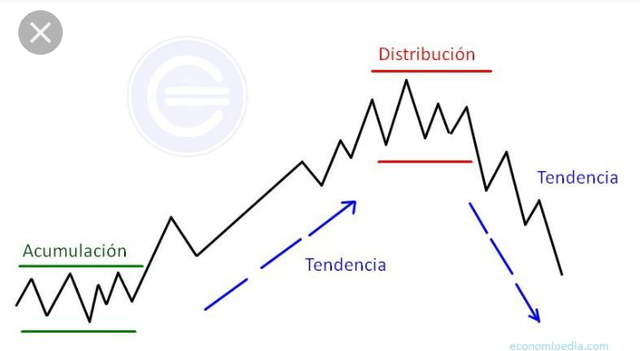
¶ Accumulation Phase: In this first phase is where assets are accumulated waiting to be sold depending on the trend they present, here investors or traders expect these assets to present an upward trend to define what they will do with them, this depends on volume presented by these graphs. We are can be acquired and there may be a lot of negotiation for each asset. If there is not much interest in the assets, the volume will hardly be noticed, the composite man hogs these assets before investors enter the market
¶ Bullish Trend: Within this phase, investors visualize and analyze the constant volume at each peak, this is done to be able to wait for the precise moment to buy or sell assets, this is done once the accumulation ends, where the man Compound will try to raise prices, causing investors to invest in them.
¶ Distribution: This is the phase of a cycle. Here the price moves a lot laterally after a great trend has elapsed, investors with reliable information begin to get rid of large packages of shares or assets, this distribution lasting for several months. Making the demand I was satisfied, leaving only a few buyers out at the last minute.
¶ Downward trend: In view of the fact that the composite man negotiates all his assets, he will now be given the task of activating the market so that prices continue to fall, because the offer is higher than the purchase, this because the majority of investors also want to sell because the price keeps falling so as not to lose so much capital.
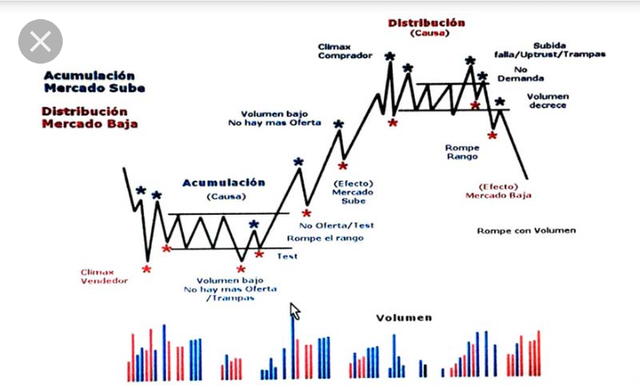
The Fundamental Laws are:
✓ The Law of Supply and Demand: This law guides us that prices rise when demand is greater than supply and fall when it is the opposite, that is, when there are more people buying than selling, it is because prices are very high. high, but when it is sold more this causes the price to fall.
✓ THE Law of Cause and Effect: This law establishes a difference that exists between supply and demand, where there may be preparation periods, that is, when assets are accumulated, this is a (cause), which leads us to exist an uptrend being this an (effect) and this is usually the case in the downtrend but here the assets tend to be distributed (cause) and prices fall (effect).
✓ The Law of Effort versus the Result: This law explains that asset prices are the result of the efforts made while there is volume, more negotiation there will be and thus the trend will probably continue, that is, if the price is in harmony with the volume trend may continue.
In my opinion, this method offers us reliability, this work done by the composite man, is certainly valuable for thousands of investors, traders and analysts, this work is very useful to understand the common cycles of financial markets.
- Share a chart of any cryptocurrency (I will not accept BTC or ETH as examples in this task). And analyze them by applying this method. It clearly shows the different phases, how the volumes change and gives details of what you see.
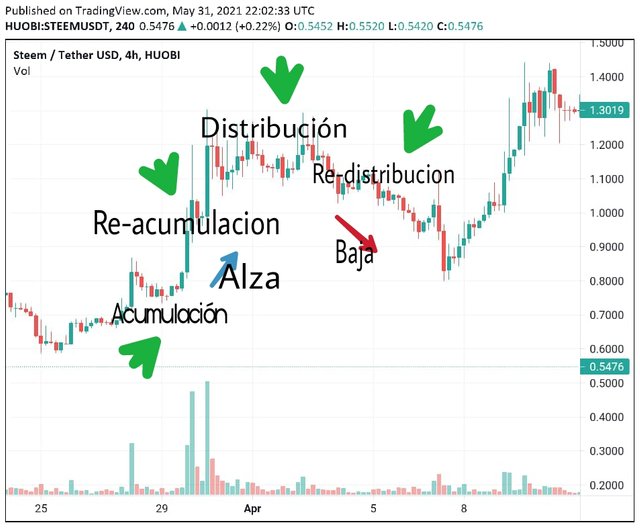
In this 4h steem / tether USD chart, HUOBI vol, I will indicate all phases of the Wyckoff method.
- Accumulation: it is clearly noticeable how on date 29 the market is lateralizing, seeing the volume that it remains stable, that is, there is not much volume, the price is stable and it shows how the cycle is beginning.
- After a rise, although it is noticeable that it was not so great, it is visualized as a re-accumulation is seen again and then it pauses until it takes a strong rise for investors to react to this.
- Arriving at the distribution phase in this it is noticed how the volume increases, in the same way it is noticed how the prices touch the peak, it is here where investors take the opportunity to sell their assets or shares despite the fact that a decrease is approaching. a cycle of redistribution.
- Bearish trend: Here the price drops and it shows that there is a small redistribution.
Conclusión
Conclution
This Wyckoff method focused on understanding the different price trends, today there are many operators that use this method, largely due to its meticulous structure, systematization and logic in order to identify high probability operations and that you are are profitable for each user, this method requires a lot of practice, but it is worth the effort and put it into practice
Thank you for being part of my lecture and completing the task!
My comments:
Las explicaciones estuvieron muy bien!
En lo que respecta al ejercicio practico, el grafico es un poco dificil de seguir, ya que solo lo señalizaste con flechas y el analisis fue algo breve, me hubiera gustado un poco mas de desarrollo!
Overall score:
6/10
Buen día profesora muchas gracias por sus sugerencias trataré de que en las próximas clases hacerlo lo mejor posible