Hello my dear friends of this prestigious community of the cryptoacademia, this time I give continuation to the assignments of this week, today with the excellent explanation of the professor @ kouba01, after reading I am about to answer the following questions

logo diseñado por @yorma con aplicación logo designer
1.- What is the RSI and how is it calculated?
The RSI is a graphic indicator of trading levels that allows to measure the speed of prices, the purpose of the RSI is to regulate purchases and sales in the markets, through this, people who carry out trading have the possibility of being guided if they wish buy or sell according to the points it generates, the RSI has been used for a long time by the trading stock market, it emerged between the 70 and 80 since then its use has been of great help to determine the over purchases and over sales and that is where there may be a change in trend; This indicator works under the margin of 14 (minutes, hours, days and even weeks) according to the configuration given. The RS (relative resistance) calculation mode is as follows: the average gain / average loss, in this case what we must do is divide what has been gain with the losses that have been had, this will be equal to the relative resistance .
In order to calculate the RSI 100-100 / (1RS) where RS is the relative resistance.
This indicator is reflected in a graph with a scale of 1 to 100.
2Can we trust the RSI when trading cryptocurrencies?
How could I observe the RSI indicator is used for many years and the credibility and reliability margin demonstrates its effectiveness, the RSI is used in the traditional market and this generates more confidence in its processes. I would trust the RSI configured according to my estimates, particularly over short periods of time. It is important to make use of the RSI when estimating a purchase or sale to guide yourself if it is the right time to carry out the process.
3 How is the RSI indicator set on the chart and what does the length parameter mean? Why is it equal to 14 by defaul.
Step1: enter the main page of coinmarketcap, and the pair of your preference will be selected.
Source
Step 2: You will click on the option trading view
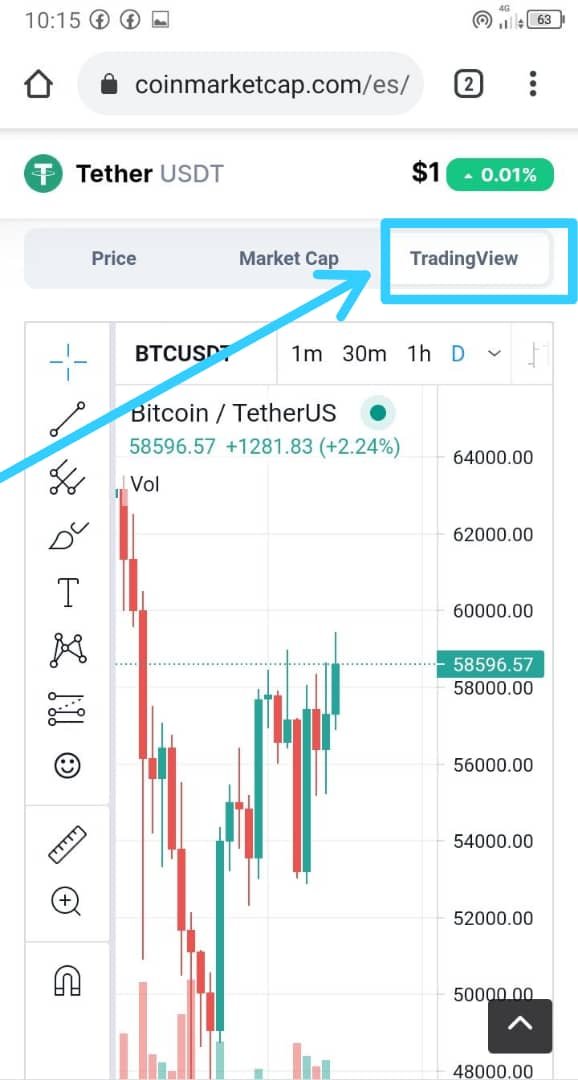
Source
Step 3: on the next screen you will click on the option fx indicators
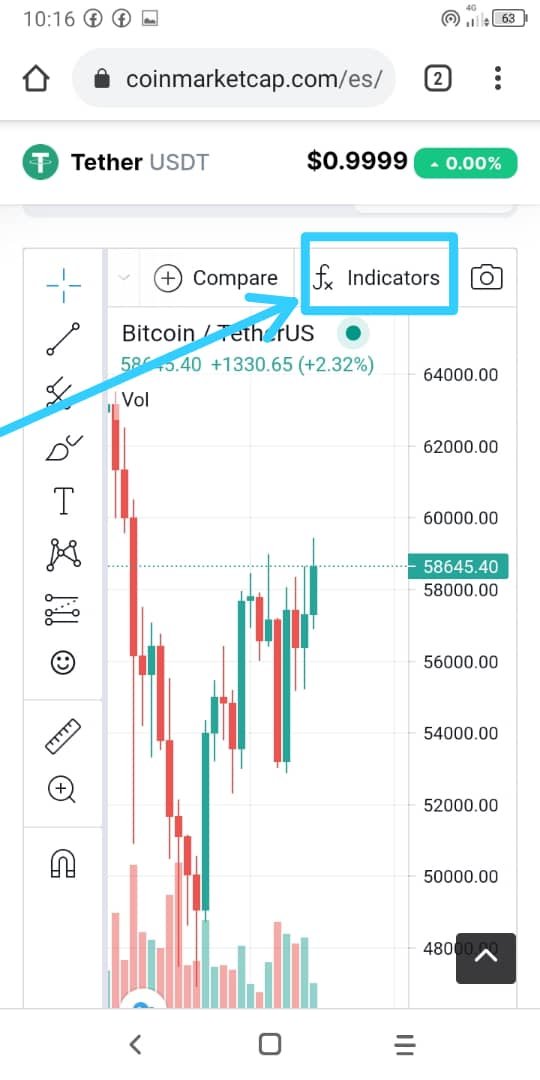
Source
Step 4: A magnifying glass will appear in which the initials RSI will be placed at the bottom, relative strength Index will automatically appear and it is selected.
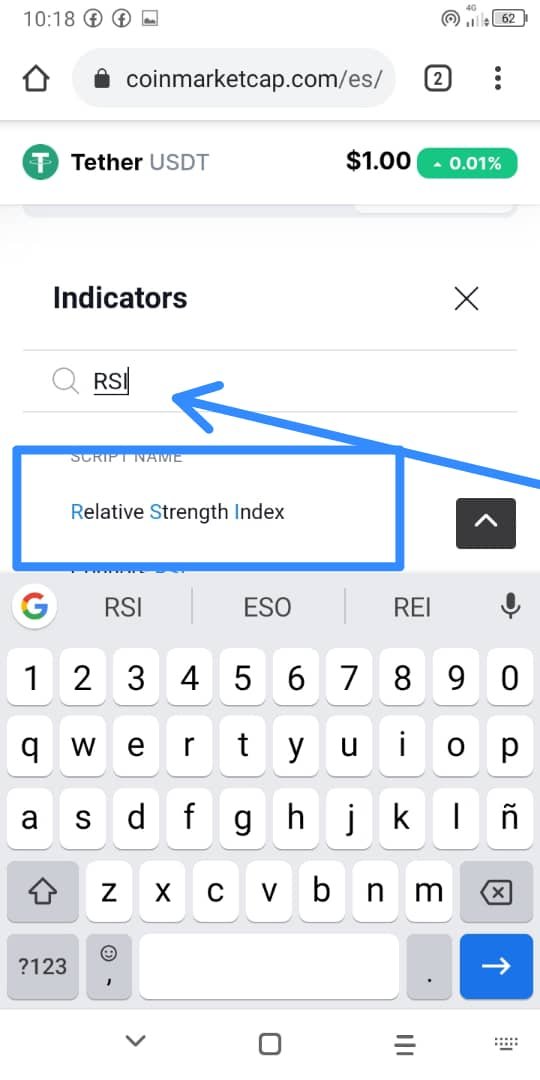
Source
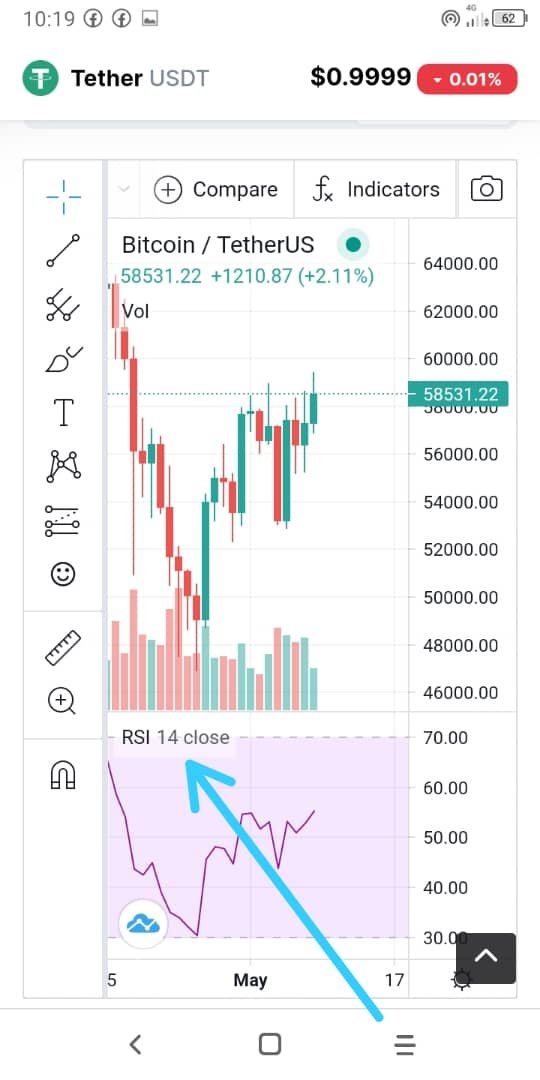
Step 5: It can be seen that the SRI is 14.
Source
Step 6: we go to the configuration option
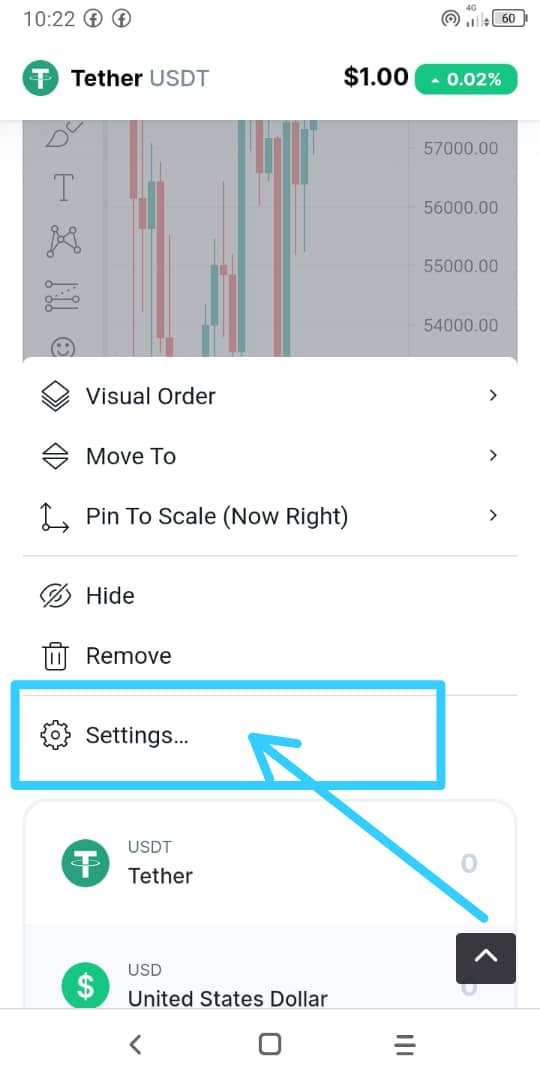
Source
Step 7: and this is where the desired settings can be made.
Source
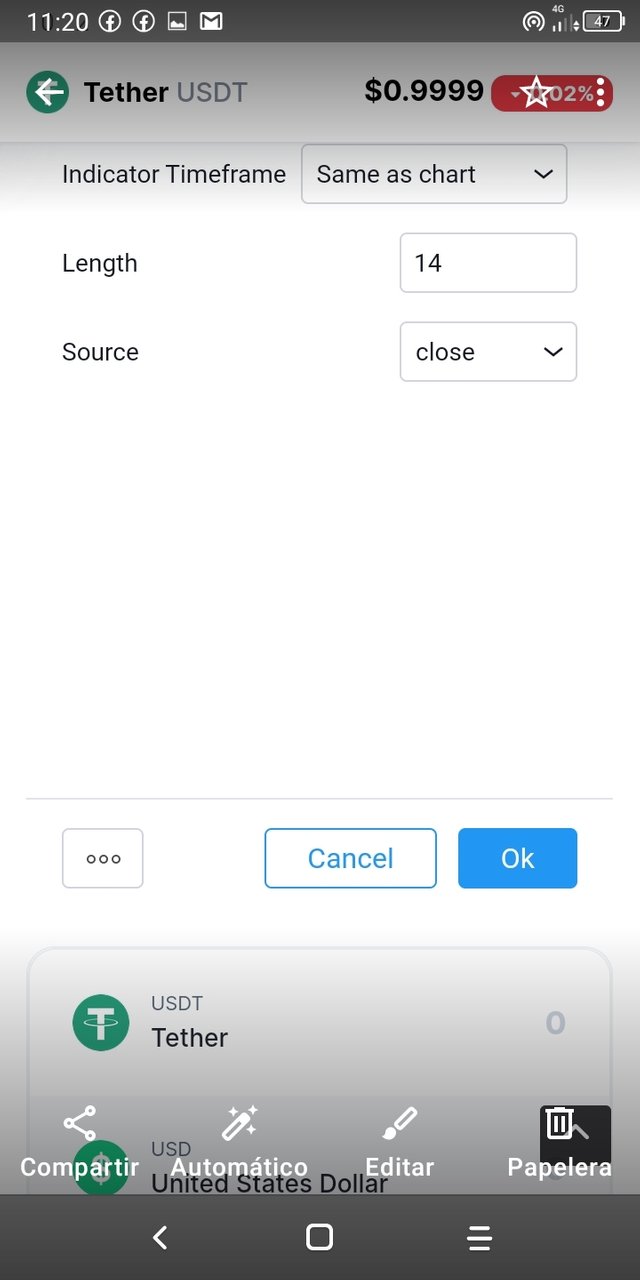
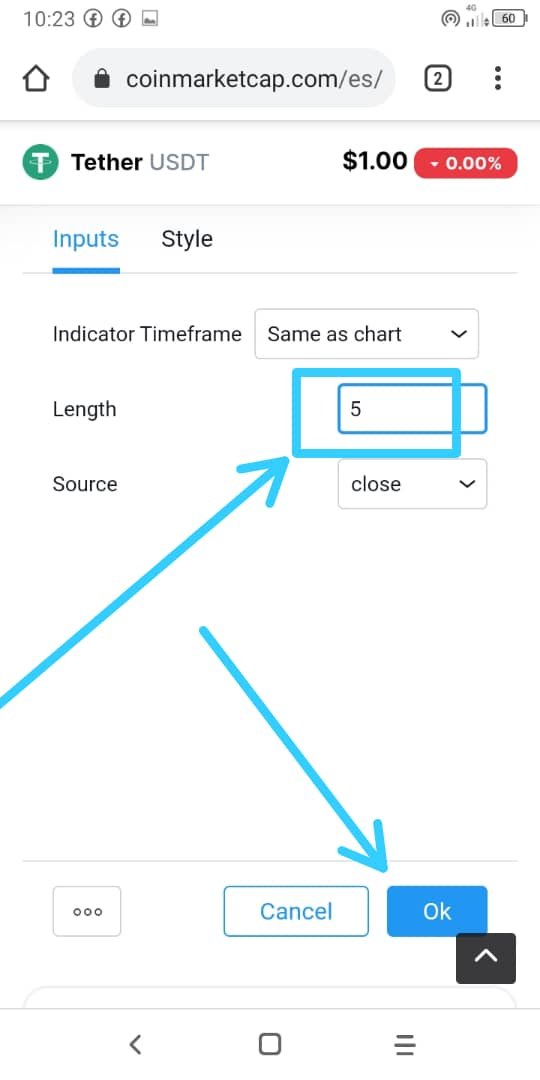
Length parameter
If modifications can be made, to modify the length parameter is done as follows
Source
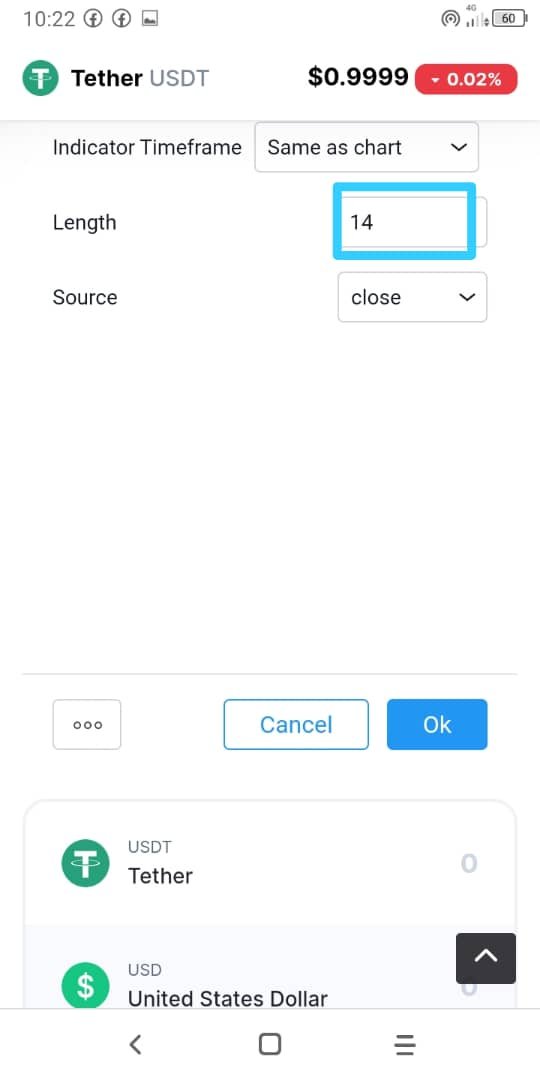
The period of time is modified according to the preference of each user and click on ok
Source
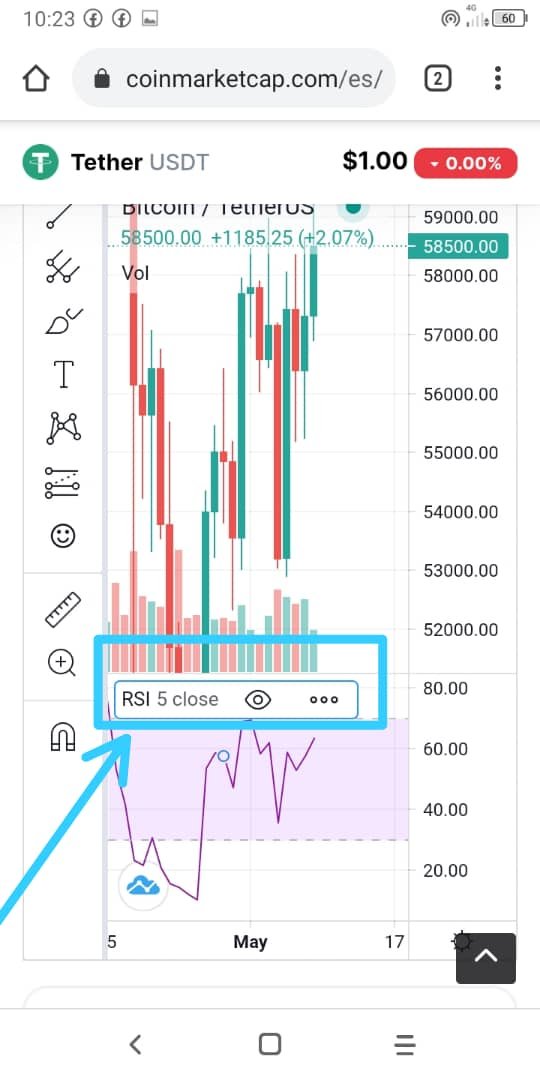
And ready here then to observe that the modification was made.
Source
The RSI indicator is a standard marker and was determined 14 by its creator, since it determined that it was the most feasible and effective way in the different trends in assets, the configuration can be made according to the interests of each user.
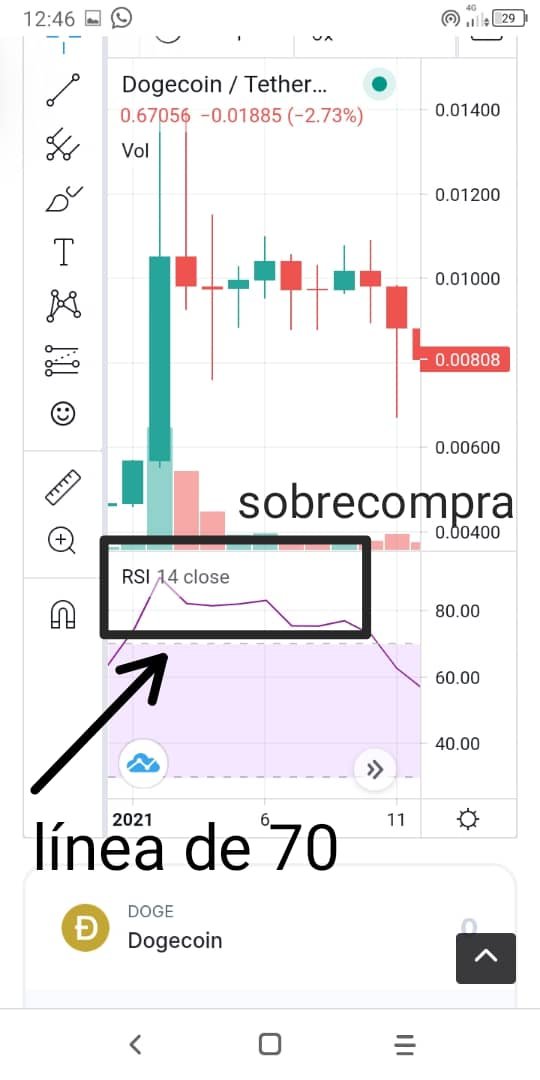
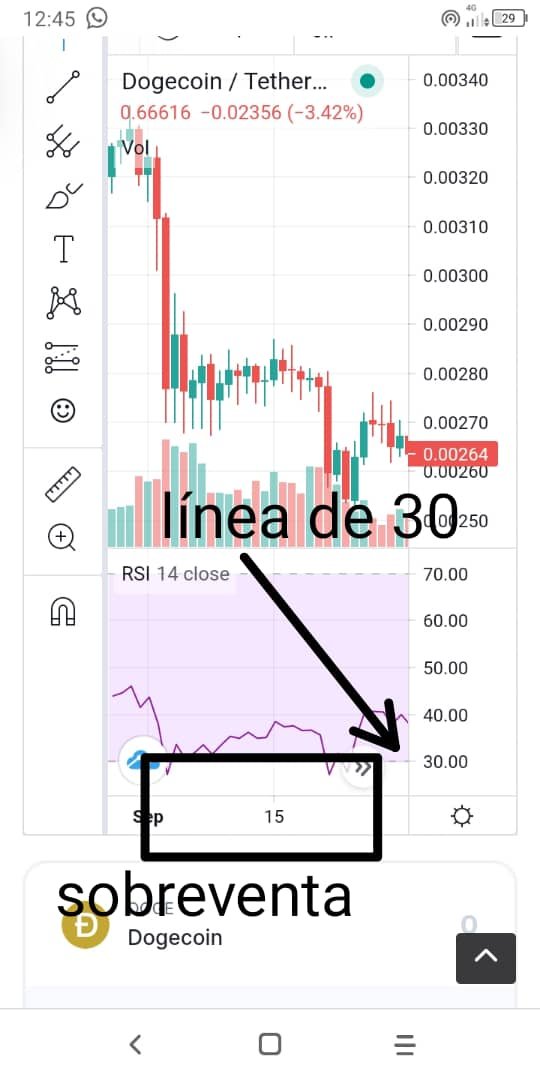
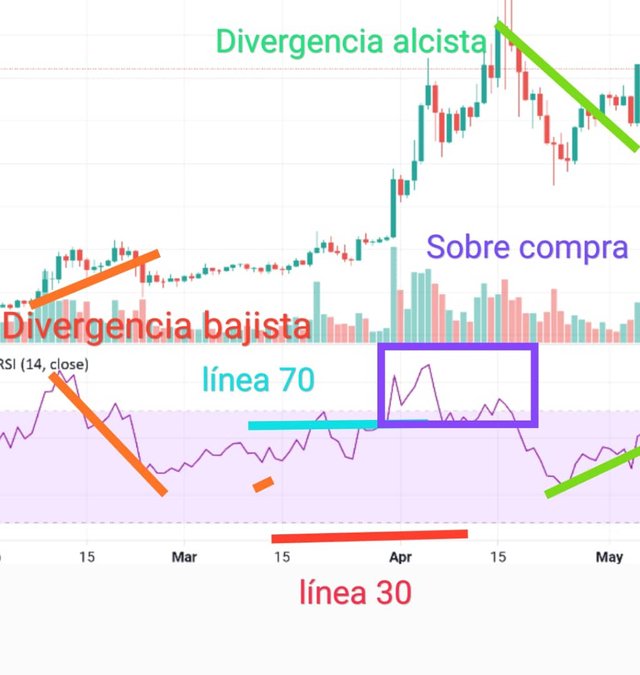
4.- How to interpret overbought and oversold signals when trading cryptocurrencies? Requires screenshot
At the moment of visualizing the RSI we will notice that the upper part will indicate the highs, that is, the overbought, these will be determined once the indicators exceed the 70 line and in the lower part the low that means the over-sale and will be determined once the indicators are above the 30's line.
Overbought
Source
Oversold
Source
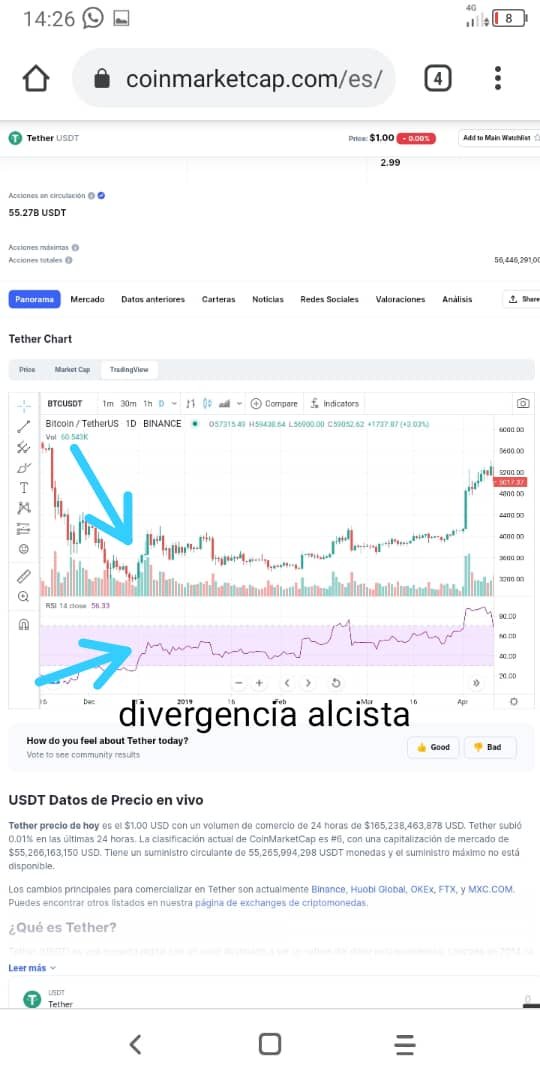
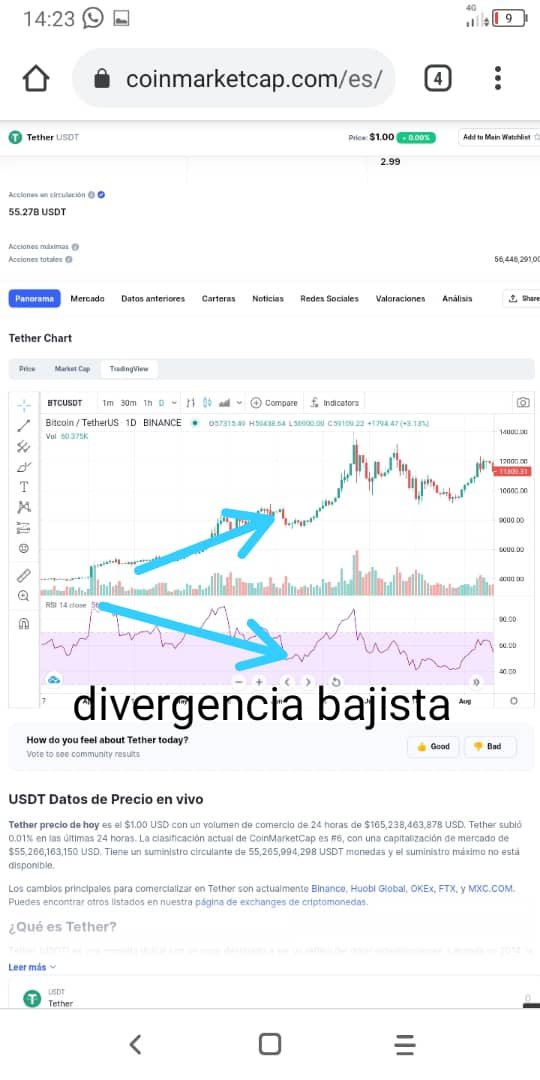
5.- How do we filter RSI signals to distinguish and recognize true signals from false signals?
This can be distinguished through the bullish or bearish divergences, to know these signals in the bulls there is a trend when prices have a fall but for the bearish divergence the graph indicates a downward trend and there is an increase in the strength of the prices, it will be best exemplified by captures.
Source
Source
6.- Check the chart of any pair and present the various RSI signals.
5.- Revise el gráfico de cualquier par y presente las diversas señales del RSI.
Source
Conclussión
It is very important to have knowledge about the RSI since it allows us to analyze through the charts, the buying and selling processes that occur in any market, before trading with any pair we should walk through the RSI since it is a process that provides effectiveness and reliability in its processes, in this way we can ensure that a purchase or sale is made at the right time.
Thanks for reading my assignment.
Cc:
@kouba01
Hello @yorma,
Thank you for participating in the 4th Week Crypto Course in its second season and for your efforts to complete the suggested tasks, you deserve a 4/10 rating, according to the following scale:
My review :
An article lacks a lot of work in terms of information and analysis, which made your answers unclear.
Thanks again for your effort, and we look forward to reading your next work.
Sincerely,@kouba01