Steemit Crypto Academy | Trading with the MACD indicator – Homework task for @kouba01
The MACD indicator is simply described as a trading indicator often used by traders and investors in ascertaining the direction and strength of a trend, predicting potential market price reversals and the potential entry and exit trade positions.
In comparison to the RSI, I perceive, the MACD indicator to be better; the reason being, it is a combination of various indicators(signal line, MACD line and histogram which aid a trader in making a more solid judgment in his day to day crypto trading.
How to add the MACD indicator to the chart, what are its settings, and ways to benefit from them? (Screenshot required)
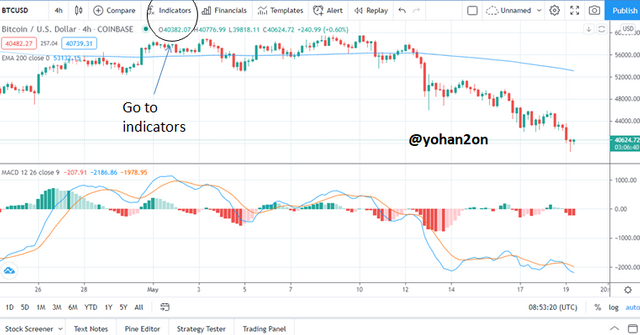
I used the BTCUSD 4 hour trading chart. To add the MACD trading indicator;
Simply go to indicators which is on the top bar of the trading chart.
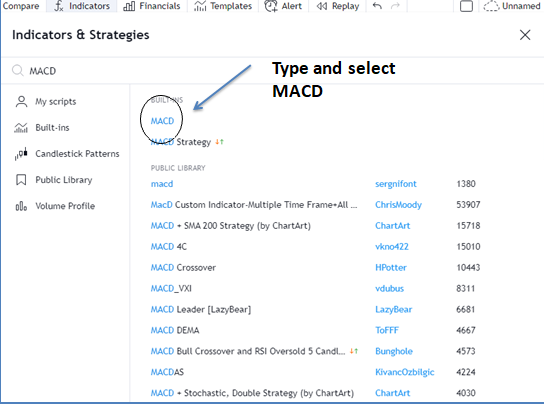
Type and Select MACD
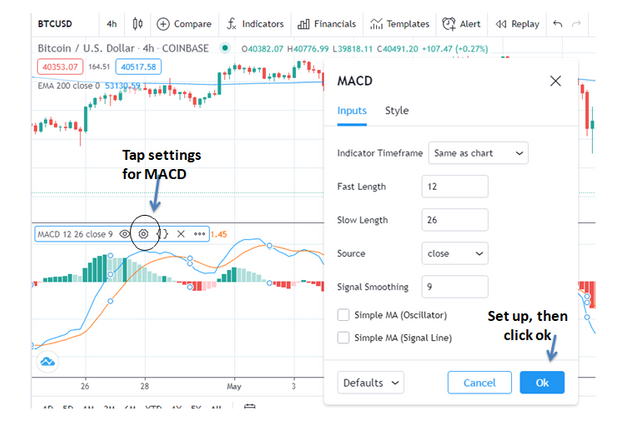
Set up MACD - 12 ,26 ,9
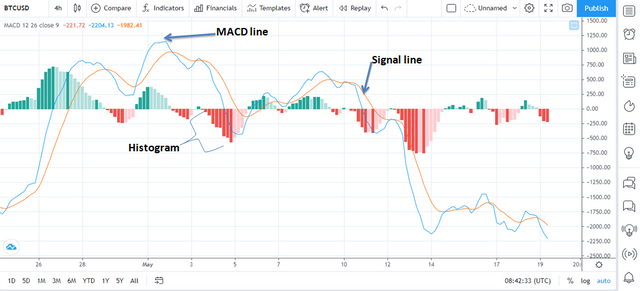
Signal line
By default, this is set as a 9 simple moving average. It’s a very fast-moving average. Literally implying that it reacts quickly to price action. This provides a trader with a quicker signal in regards to the direction of the trend. It acts as a leading indicator within the MACD. However, it’s used in relation with the MACD line. For instance the crosses below or above by both MACD line and Signal line showcase a reversal signal of the market.
The MACD line
This is obtained through the difference between the short term Moving average and the Long term moving average. For instance 12EMA – 26EMA = MACD line. In other words, the MACD line is a combination of 2 EMAs (12EMA and 26EMA).
Histogram
This is a bar chart like feature on the MACD. You can spot it close to the zero line. What is its essence? The histogram simply showcases the difference between the MACD and the balance lines. Traders can easily identify the trend by simply looking at the formulated bar charts whether the upper side that is for the uptrend or the downer side for the downtrend.
How to use MACD with crossing MACD line and signal line? And How to use the MACD with the crossing of the zero line?
MACD line and Signal line Crossing
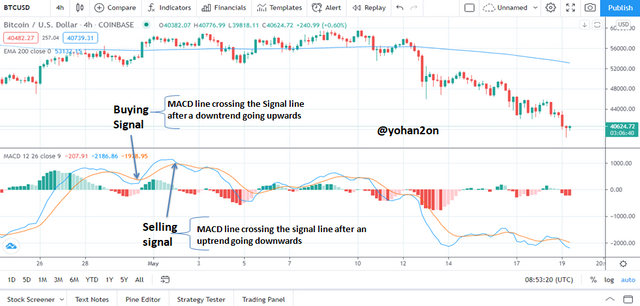
When the MACD line crosses the Signal line from a proceeding downtrend going upwards, this signifies to us a buying signal. On the other hand, when the MACD line crosses the Signal line from a proceeding uptrend, this signifies to us a selling signal.
MACD line crossing the Zero line
When the MACD crosses the Zero line while proceeding downwards it signifies a sell signal. On the other hand, when the MACD line crosses the zero line proceeding upwards, it signifies buying a signal.
How to detect a trend using the MACD? And how to filter out false signals? (Screenshot required)
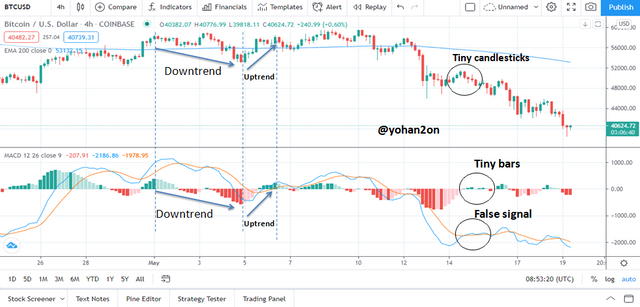
Using the MACD, you can detect a downtrend by first looking at the state of the bar chats displayed on the Histogram. Since in trading, “whatever goes up must always come back down”. We can therefore use the Histogram to capture a trend reversal, during the reversal, the bar chats appear faint implying that the market is tired of going in that particular direction; it, therefore, begins off another trend. If this is well mastered, you can capture a trend very early and make some good profits.
A trend can also be detected by relying on the MACD line and Signal line crosses. Whenever the MACD crosses the Signal line, it signifies the beginning of another trend.
How to filter out false signals
It’s not good to trade while relying on one particular indicator such as the MACD as these sometimes give false signals. We can filter out false signals through the use of other indicators such as the price action (candlesticks). When there are tiny candlesticks formulated, you have to be careful with your trade decision at that moment. That would just signify to you that it’s a fake-out. Here the market can either go up or downwards.
You can know false signals by also looking at the size of bar chats displayed on the histogram. If they are too tiny, then that would definitely be a false signal.
How can the MACD indicator be used to extract points or support and resistance levels on the chart?
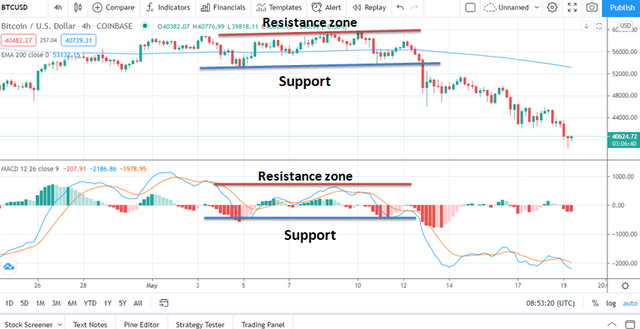
At the pick of the histogram for instance below the zero line, it forms a support point and at the pick of the MACD line, the MACD forms a resistance zone.
Cc: @kouba01
Hello @yohan2on,
Thank you for participating in the 6th Week Crypto Course in its second season and for your efforts to complete the suggested tasks, you deserve a 7/10 rating, according to the following scale:
My review :
Article with good content in which we find precise and correct answers but lacking in-depth analysis. You also skipped the last question which summarizes all the uses of the MACD indicator in cryptocurrency trading.
Thanks again for your effort, and we look forward to reading your next work.
Sincerely,@kouba01
Thanks so much for the review ☺️. Will definitely be kin next not to miss out any question.