Crypto Academy / S4W4- Homework Post for @reminiscence01".
logo made on Wix logo maker.
Hello Steemians!
I hope you are doing well in your life. I hope you are keeping your health in this pandemic as first priority. So this is my homework post for @reminiscence01. The topic is Technical Indicators 2. So let's get started.

QUESTION 1
a) Explain Leading and Lagging indicators in detail. Also, give examples of each of them.
Answer:
As we already know that there are hundreds of technical indicators available for traders to use and anticipate the upcoming prices, trends, reversals, breakout etc., but, a good trader is the one who uses just the right indicator for just the right strategy. Your strategy play an important role here. You need to know what you have to do in order to use just the right technical indicator. There are two types of indicators that a good trader must know before using it for their trading strategy.
Leading Indicators
Lagging Indicators
Leading Indicators are the comparatively faster ones because they can anticipate the prices much more early and at the beginning of a trend, breakout or a reversal. It's prediction is in the direction of the change and provide signals on time so that a trader will know when to enter or exit the market. Leading Indicators are best use for short term intervals and for short term trades when you have to just make the decision on time. It minimizes the stop loss limit of a certain trade. In terms of Leading Indicators it's not always all good and nothing bad, because these indicators are often misleading or inaccurate. Take RSI for instance, it tells us when an asset is overbought or oversold. A trader will look at it and will make the decision according to it but it is not always correct. Sometimes, it can remain in an oversold or an overbought position for a very long time if the market is trending strongly.
Examples of such indicators are RSI, Stochastic Oscillator etc.
Lagging Indicators on the other side are the slower ones and often provide signals when a trend, breakout or a reversal has already started. It has a wide range and thus is best suitable for the strategies that are for long terms. The stop loss limit is increased too and the risk is minimized so does the profit too. If you are a long term trader, the best indicators used are the lagging ones, it tells and confirms the signals that are already being seen but not yet confirmed. The advantage of these indicators are that they can't be changed due to price manipulation. The demerit here is that if you are have a short term strategy, these indicators will give out the signals when it is already too late and a if the trend is weak, a possible reversal might result you in losing.
Examples of such indicators are Moving Averages, MACD etc.
b)With relevant screenshots from your chart, give a technical explanation of the market reaction on any of the examples given in question 1a. Do this for both leading and lagging indicators.
1. Leading Indicator - Stochastic (Stoch)
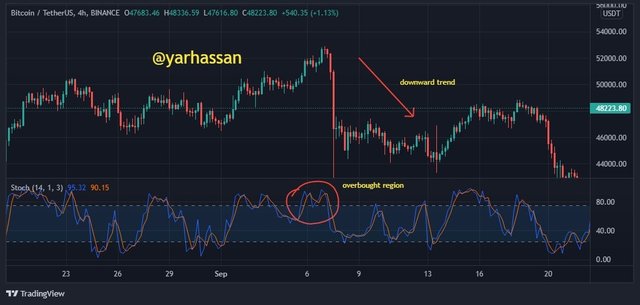
Source of screenshot is @Tradingview
As we can see from this BTC/USDT chart above the overbought signal given by the popular Leading Indicator Stoch, gave us a sell a signal and immediately after that a heavy dip in the price of bitcoin is observed and the downtrend is started.
2. Lagging Indicator - Parabolic SAR
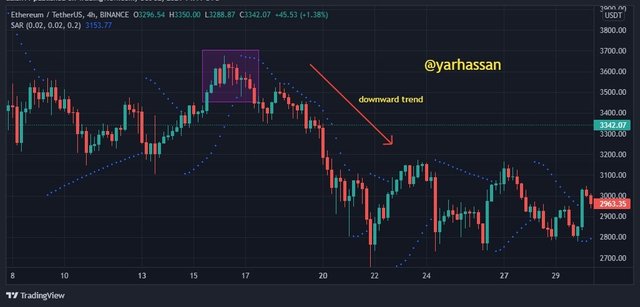
As we can see the ETH/USDT chart above that the dots of Parabolic SAR are below the candles indicating not to sell the asset, but when the dots begin to appear above the candles, it indicated that we should now sell and the bearish trend is about to be started from the area represented by the rectangle.

QUESTION 2
a) What are the factors to consider when using an indicator?
Answer:
A trader must keep in mind the following factors before using an indicator
1. Understand the market trend.
As we say in trading, trend is you friend. A trader must know which type of market he is dealing with and which type of trend is it representing. There are trending markets and there are ranging markets.
In trending markets a trader must use trend based indicators to know the best point to enter or exit the market
While in ranging or sideways market, it is always wise to use volatility or momentum based indicators
2. Understand your trading strategy.
This is probably the most important factor that is needed to be understood by a trader. Unclear strategy of a trader always results in loss. You need to use the best technical indicator amid your trading style. If you are a short term trader you can't just use lagging indicators and expect to gain a profit and if you are a long term trader, only leading indicators can't help you to make the right decision. Trading style depends the most on using the right technical indicator.
3. The understanding of the types of indicators
You must know the two types of indicators in order to become a good trader and you also need to know when to use what. As we mentioned earlier, there are two types of indicators * Leading and Lagging Indicators *
Leading Indicators are powerful, strong and sharp in determining the trends and price movements whereas, Lagging Indicators are momentum and volatility based and gives the measurements needed to make long term decisions.
4. Finding confluences.
You find the right technical indicator according to your trading strategy, the nest step is to confirm it through confluences that is confirming it by other indicators and tools before making an order. For example you have to place a buy order in the oversold region, you have to first confirm it by other tools and indicators like parabolic SAR if the signal is correct or not or if the reversal in the price movement will take place or not.
b) Explain confluence in cryptocurrency trading. Pick a cryptocurrency pair of your choice and analyze the crypto pair using a confluence of any technical indicator and other technical analysis tools. (Screenshot of your chart is required)
Answer:
Confluence is the situation where you have to use multiple tools and technical indicators to confirm the signal provided by a single tool/indicator before making a trade.
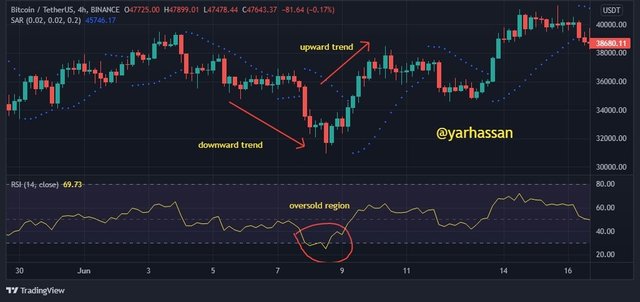
For example if you are trading BTC/USDT pair and you used a leading indicator (RSI) to predict an oversold position to place a buy order in the dip. Now, to confirm it if it is not a fake signal or a fake reversal we also use parabolic SAR, and if the price moves above the dots of the SAR it confirms the signal is authentic and you can place an order here. The same phenomenon is shown in the screenshot below taken from @tradingview
QUESTION 3
a) Explain how you can filter false signals from an indicator.
Answer:
The best way to filter out a false signal is to check the confluence of the indicator by using some other indicators/tools or with the price action of the crypto. The signal is false if the price action is the opposite of the signal provided by the indicator. As we can see in this screenshot below
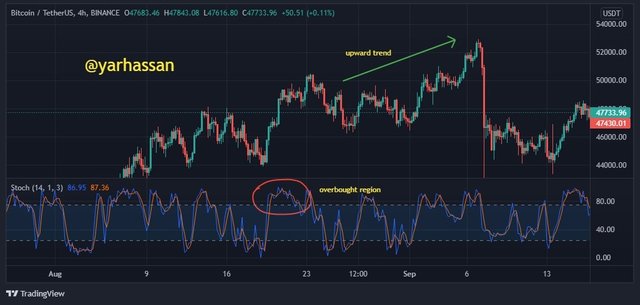
Stoch gave out the overbought signal but the price action of BTC/USDT is still maintaining its upward trend confirming that the signal is false and it is not confluence with the price action.
Source of screenshot is @Tradingview
b) Explain your understanding of divergences and how they can help in making a good trading decision.
Answer:
Divergences occur when an indicator and the price actions are opposite to each other. For example the price action of any specific crypto may be moving in higher highs but the indicator may be moving in lower highs. It represents possible reversals. Divergences help traders to filter false signals and upon doing confluence a trader can remove these false signals and make the correct trade.
c) Using relevant screenshots and an indicator of your choice, explain bullish and bearish divergences on any cryptocurrency pair.
1. Bullish Divergence
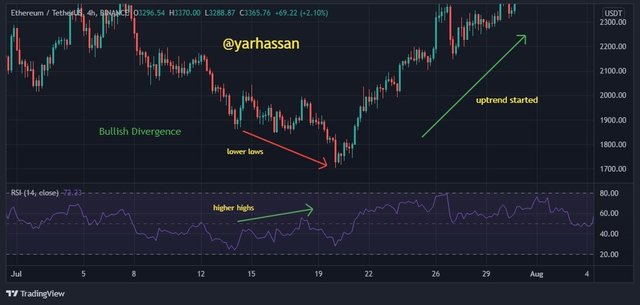
As seen in the ETH/USDT chart above that the price action of ETH is forming lower lows and as seen by the RSI, it's indicating us the the bears are losing momentum and the bulls are gaining the momentum back by forming higher highs and a possible reversal might happen here and later it is confirmed by the uptrend appearing on the right.
2. Bearish Divergence
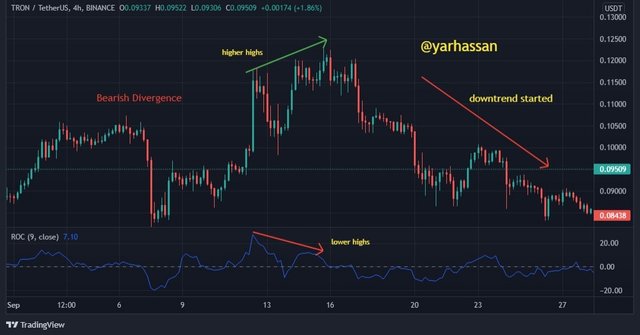
In this chart above that is of TRX/USDT we can see that the price action is moving with an uptrend and forming higher highs while the indicator ROC is indicating us that it is moving downwards forming lower highs which means the bears are gaining momentum. It is later seen that the Bearish Divergence is true when the bear market has started with a downward trend.
Conclusion
Upon completing this homework task given by @reminiscence01, we learned the types of indicators, when and where they are used, some of their examples, the factors that must be considered by the traders when using the indicators, how to filter out false signals, to do confluence and the two divergences which are important in crypto trading.
Hello @yarhassan , I’m glad you participated in the 4th week Season 4 of the Beginner’s class at the Steemit Crypto Academy. Your grades in this task are as follows:
Observations:
That's correct.
Recommendation / Feedback:
Thank you for participating in this homework task.