{Steemit Crypto Academy - Season 2, Week 6} Elliott Wave Theor: Post by Prof @fendit //Homework done by @xkool24
Hello Prof @fendit and steemians, it is my great pleasure to participate in this week's Homework task and Class/Lecture on Elliot Waves Theory (EWT). Moving straight to the task of the day...
(BTC/TRX pair)
Homework for this lecture
A) Share your understanding on this lecture by answering the following questions:

What's the application of this theory?
The application of this theory unveils vast lessons in the application of some principles in following market trend before making trade decisions. Just like discussed in the class, the theory helps in the identification of market direction and trend which determines the bullish and bearish trends of assets price, bearing in mind the psychological factors surrounding the investors in the trade.
Elliot went further to ascertain that the unstable psychological factor seen in the masses that affects the up and down movement is attributed to the waves, and this wave are like fractal nature which are similar in different scales with infinite repetitive forms. This clearly shows a repetitive market pattern seen overtime in the nature of psychological trends which can be used to determine the the actual trend of trade when out in use.
This theory try to point out some important basis for us as regards price action and determinants. When there are actions made, there are equal and opposite to balance and counterbalance the actions. When the price of an asset increases, it is obvious that we will find more people trying to sell off their assets to make profits , and when the price drops, we will also find more people trying to buy-in more of this assets (because of low asset value) and lesser people selling off.
This theory enhances and enrich market strategy and i the identification of stop loss. It is seen to use the impulsive and corrective wave patterns in directing the investor on when to stop loss or cash out after making profits. In the bullish impulsive wave pattern where the first-5waves are seen on an uptrend and the last 3-waves seen on the corrective wave trend, it invariably directs the trader to know when to sell off at either on the long wave seen in 3rd-wave or HODL and make a exit position in the 5th wave pattern before market corrects itself. This theory invariably gives the trader a quick market decision and direction on where to draw its analysis as soon as he sees this patterns. The good things here is that this pattern are repetitive though on a different scale patterns.
Then lastly, the EWT theory has shown that it works more efficiently and effectively in combination with the MACD and RSI which duo has the ability in delivering a complete data value in making both entry and exit positions in a trade which is seen inconclusive in the EWT alone.
What are impulse and corrective waves? How can you easily spot the different waves?
Having known that Elliot wave theory is also a market indicator that specifically direct us of the market trend by taking into cognizance the rise and fall of market trends bearing in mind the psychological factors of the investors and participants in the trade, these theory basically works with the idea of two (2) waves;
IMPULSIVE WAVE: In applying the EWT, markets are always seen to be bearish or bullish and this determines the nature of the impulsive waves if it should either be in the bullish or bearish trend. But basically the impulsive trend moves in same direction with the market trend. It is a wave that is in agreement with market and trade movements. It the market is seen to be bearish, the impulsive wave would also move in same bearish trend vis versa. The impulsive wave is a YES YES to same direction with the market forces/trends.
It is characterized with five (5) waves in its trends which are seen to be from wave 1-5. To be able to identify the individual impulsive waves, the 3rd-wave always play a spotlight role due to its long wave trend. with wave 2 and wave 4 also playing a same directional wave pattern and wave 1 and wave 5 playing a same directional wave pattern.
- Wave 1: In this wave pattern, a smaller unit of investors are seen investing in this market which sees it to the little bullish trend witnessed in its movement. Usually prices are low hence the buy-in made byu investors which guarantees them to also sell-off at the little price changes witnessed for profits.
- Wave 2: Due to the cash-outs made during the little bull-run in the wave-1 pattern, there is a little bearish trend witness and seen in the wave-2. This also reduces the prices of assets in trade and give in for a possible buy in by traders.
- Wave 3: Due to the low prices seen in the wave-2, investors buy-in into the market again just like it was seen in wave-1 but this time there is a rush in investments which sees the long bullish trend in this wave pattern. This is where we see the long wave trend in the impulsive wave pattern.
- Wave 4: This is also another similar situation seen in the wave-2 pattern and trend. Here, the long trend seen in the wave-3 led to investors making exit positions just to make profits and hence led to slight shed off from markets and bearish trend seen in wave-4.
- Wave 5: There is always an over priced region . At this peak, price trends are mostly likely to reverse and correct itself. The little bullish trend seen was because of the little entry positions in wave-4 made after a some exit positions seen in wave-3.
Note that the best entry position in this kind of market pattern is seen in Wave-2 when traders are sure of the market trend and the best exit positions is at the peak of the long trend in wave-3 or HODL till Wave-5 and exit immediately before market corrects its self and starts a bearish run.
CORRECTIVE WAVE: Just unlike what we see in the impulsive wave that responds directly to the market trend, the corrective wave works in the opposite of the prevailing market trends. It is mostly referred to as corrective trend when market reverses itself from a particular pattern. This is seen after the 5th wave from the impulsive wave pattern. It is labelled A,B & C corrective wave patterns. Corrective wave A & C are always to have the same market trend in same direction with Wave B always in the opposite direction. This patterns may be seen as ZIGZAG, FLAT or in the TRIANGLE pattern.
- ZIGZAG: This pattern sees pattern B always different and moving in opposite direction from Wave A & C pattern.
- FLAT: This is aposition where all points of market trends are equal unlik what is seen in the zigzag pattern. This may be alittle difficulty to decode.
- TRIANGLE: Also another difficulty spot to trace, but at this time its pattern clearly shows that volatility and volume is decreasing.
What are your thought on this theory? Why?
Every market tool are saddled with Pros and Cons and the EWT isn't an exception in this regards. The most important thing is to make out the best out of the tool we are imploring leveraging on its benefits. From study and its working patterns and technical analysis, the EWT is seen to be proficient in identifying STOP-LOSS given to the market trends at the point of trade. This is a veritable tool that should guide Traders and put their losses in check given to its proficient management of Losses with the EWT. Traders are put in an advantageous position to always know when to place the STOP-LOSS or monitor the patterns which give them future and possible occurrence of the impulsive and corrective wave pattern.
Let us always remember that this wave pattern is FRACTAL in nature where it is seen to be repetitive and never ending with similarity seen on different scales.
Since the EWT is seen not be more detailed in providing complete and technical data for traders to execute ENTRY & EXIT positions in the trade, its combination with the MACD and RSI as a supportive market tool would be a better combo seen in providing for traders exit and entry positions in the trade. So the use of the EWT with this combo also makes it a more detailed and proactive indicator.
Lastly, the EWT is excellent in predicting the strength of market trends which places traders in an advantageous positions in making profits given to its position to proffer entry and exit positions after due diligence to harness the prevailing price changes in trade to their favor.
B) Choose a coinchart in which you were able to spot all impulse and correct waves and explain in detail what you see. Screenshots are required and make sure you name which cryptocurrency you're analyzing.
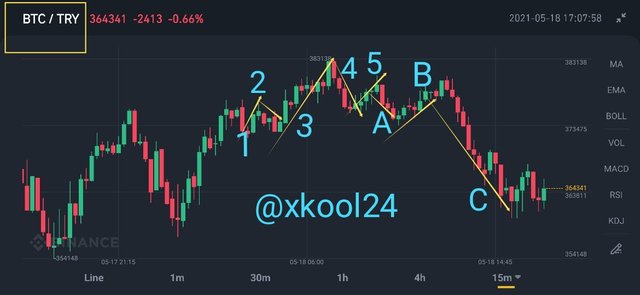
(BTC/TRX pair)
This is the BTC/TRX pair market used for the purpose of EWT analysis. The market was traced when market was alittle before 373,475 mark, some few traders were seen making entry positions into the market which gave it some bullish trends. And when there some price differences, traders were able to make some exit positions with some profits accrued which saw the the bearish trend in wave-2. When prices were seen to drop at wave-2, More investors/traders quickly made an entry positions this time more than what what was seen from the entrance of wave-1, hence leading to price rush and long trend seen in wave-3. Ordinarily, when we are at liberty to be at an advantageous positions like this, we are expected to make some exit positions and make good profits which are also the resultant effect of the bearish trend seen on wave-4. These exit position in wave-3 vis-a-vis low price witness thereafter would naturally attract more traders to make an entry positions which births wave-5.
Key highlights:
- There are little entry positions and investment from traders in Wave 1.
- There are price dips from exit positions made in wave-1 due to some bullish trends seen vis-a vis low price in Wave-2. This attracts more investors to make stronger entry positions.
- There is always a long trend seen from the Wave-3 which exposes the traders to more profits from price changes and also more exit positions. There are influential effects on the next pattern which is wave-4
- There are bearish positions seen i the wave-4. This also scenario also plays out in the wave-2 trend pattern.
- A little bullish trend is witnessed in wave-5 before market corrects itself.
Immediately this is seen in wave-5, the market reverses and tow the line of a corrective wave as captured in the screenshot. Just as seen in the market trend, corrective wave A & C are seen to follow the direction and trend pattern, hence leaving its counterparts B on a solo different or opposite pattern.
In conclusion, the EWT is a market indicator which happens to work individually with ability to dictate strength of Market trends and STOP LOSS, with also capacity to work as a combo with the RSI and MACD to effectively and efficiently dictate the entry and exit point I a trade.
Thank you @fendit, this is my entry
Thank you for being part of my lecture and completing the task!
My comments:
This work is simply superbe!
Congrats on such great work, it was really nice for me to go through your homework. All explanations were great and you made a very good job with the chart!
Overall score:
9/10
Thank you Prof @fendit. I'm well pleased with your review though my target is to make a 10 score of your rating and make your top list.
You're on the right track, then! :)
Thank you Prof, for the kind words.