Introduction to the Principles of Crypto Analysis - Crypto Academy S4W7 - Homework Post for @imagen
Hello guys, it's quite nice I participated in this week's intermediate lessons presented by prof @imagen on Principles of Crypto Analysis.
1.) What are the differences between Fundamental Analysis and Technical Analysis? Which one is used most often?
Difference between Fundamental/Technical Analysis

Fundamental and Technical Analysis are both methodologies used in the market to determine the performance of an asset over a given period or future use.
| No | Fundamental Analysis | Technical Analysis |
|---|---|---|
| 1. | While Fundamental Analysis measures more on the intrinsic value of an asset from its emergence | the Technical analysis measures the future value of an asset relative to the use of chart patterns/trends |
| 2. | Fundamental Analysis is usually carried out by traders/Investors who are Long term Investors/traders | Investors or traders are Short term based |
| 3. | Fundamental Analysis are Investors driven due to its long term duration | Technical Analysis are usually Trading driven since anticipated profit is expected in a short while |
| 4. | There are no clear scenarios where assets exact performance is considered instead generalized and treated in wholesome | Technical Analysis determines the exact scenarios when assets can be subjected to market trends for profitability |
| 5. | Takes into cognizance data for Economic, industry, News/events purposes | Data are strictly considered for Chart analysis only |
| 6. | Due to its past and present data focus, decision making is derived from available information | Data from past asset trends allows for decision making based on market trends behavior |
| 7. | Forecasting generally is done from past and present asset performance | Forecasting based on the use of chart trends and the use of indicators. |
| 8. | Measure asset worth relative to its current value to ascertain if it's Overbought or Oversold | Greatly depends on the Demand and supply principle to determine asset worth any given time which is relative to chart trend performance |
Which is Most Often Used
Answer: Technical Analysis
Due to the saturation of cryptocurrency space with short-term traders and investors who are commonly interested in maximizing profit at the shortest possible time, we see the technical analysis most often used.
This can also be supported with the use of trading indicators which are readily available to give traders a guide on the best ways to make trade positions (Entry and Exit trade positions).
Fundamental Analysis indicating the objective of the Project, Financial Metrics and On-Chain Metrics on Polkadot (DOT)
Overview of the Polkadot Project
The Polkadot Ecosystem was developed by an experienced developer and a co-founder of the Ethereum Blockchain which is a second-generation Cryptocurrency Network by the name Gavin Wood. Also in this team are Robert Hebermeier and Peter Czaban. This deployment was borne out of the continued limitations over the years of existing Blockchains' inability to interact amongst themselves.
This great development was launched after an incubation and maturity period between 2026 to 2020 to deal with issues bothering Scalability, Interoperability, and Additional Security in the ecosystem. Before its launch, there are limitations observed connecting or the interaction between one Blockchain and the other, this was exactly what the Polkadot protocol was launched for.
In resolving the scalability issues which is observed in most existing Blockchain today with varying degrees of transaction throughput, the Polkadot is observed to be connected to the Web-3 Foundation for improved Blockchain scalability. It also uses the Shared Chain feature which helps with Blockchain interaction and Interoperability that are connected to the Polkadot Ecosystem. Though they are also seen to run on a Parachains (parallel network path).
The Polkadot Ecosystem helps in connecting multi chains (Blockchain systems) in its base network but it also allows each of these connected chains to operate in a parallel manner with each other. They all operate as entities with their protocols and governance all carried out independently on the Polkadot Ecosystem but can interact when the need arises. The Polkadot has its utility token as DOT.
While leveraging on this advantage of Interaction or Interoperability and Compatibility amongst Blockchain, it uses the Substrate feature which allows developers to design their Blockchain projects. The use of the Substrate feature entails that all projects built on it can interact amongst themselves, as well as transact or transfer information to external sources also build on the Substrate feature.
In enhancing its scalability and transaction throughput, it is a fragmented Blockchain that is made up of different parts that enables it to share its function effectively and efficiently. It has the Relay Chain or Bridges which is the brain box that ensures Security, Interoperability, and consensus amongst the Parachains all connected in its network.
The Polkadot Ecosystem as we've observed is the Ethereum contender. This may not be unconnected to the fact that one of Ethereum's co-founders (Gavin Wood) is the developer of this great ecosystem which intentions of correcting the limitations found in his previous ecosystem of old.
This competition or contention between this is duo is the leverage brought up by the Polkadot Ecosystem on the area of having so many projects coming onboard on its a single network just as observed in Ethereum. In addition, it has an edge over Ethereum in its scalability, low transaction fees, forkless upgrades, and Interoperability while interacting with external Blockchain.
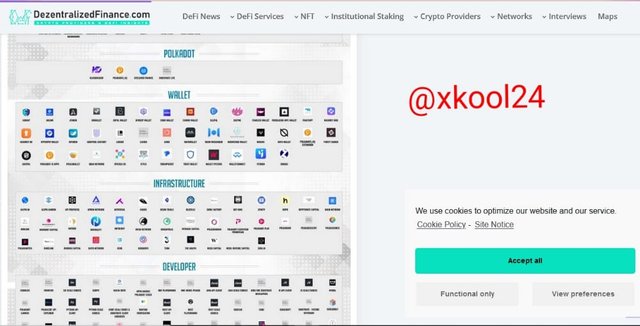
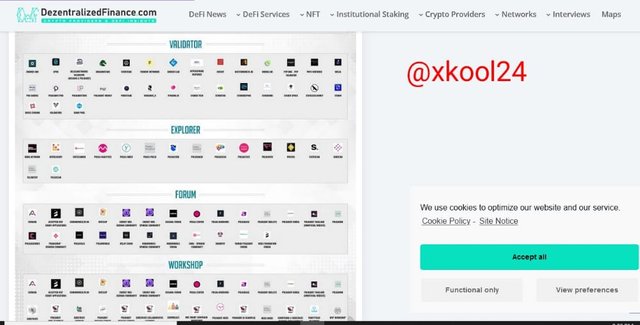
Lastly, in the Polkadot Road May for 2021 which is usually updated as the day goes by, it has the different sectors with active projects in its protocol. It has its Substratebased, Tool and APIs, Wallet, Developer, Collator, NFTs, Validator, Developer, Infrastructure, Explorer, DApp, Workshop, Forum, etc.
Financial Metrics of Polkadot Asset
This deals with some of the online metrics that identify the performance of Polkadot Asset. This can be measured by the following:
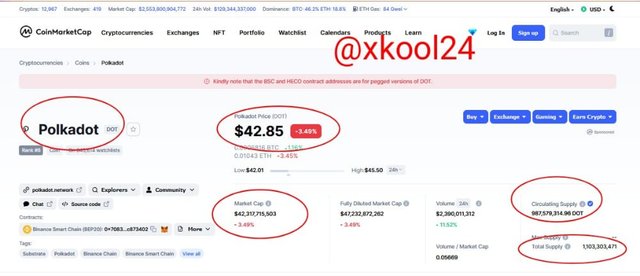
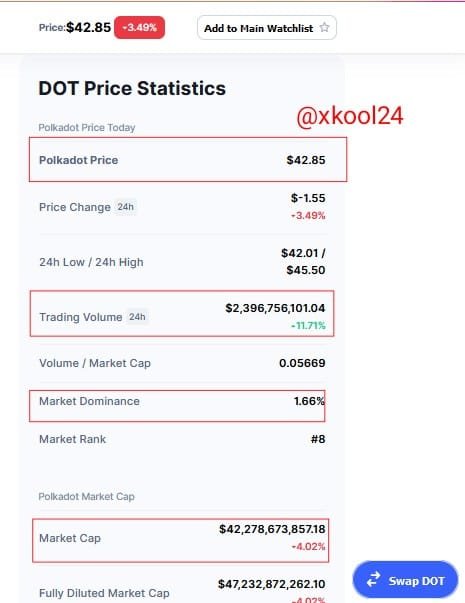
(Screenshot from coinmarketcap site)
Market Cap
This is measured by the circulating supply of an asset by the prevailing price value. We have the Price value of Polkadot (DOT) token to be $42.85 and the Circulating supply of 987,579,314.96 DOT. The Market Cap for DOT is $42,317,715,503. Just as we know, assets with lower Market Cap have a higher propensity for percentage growth vis-a-vis those with higher Market Cap. Though higher Market Cap asset comes with more stability and less risk.
Liquidity/Trading Volume
This represents the ease of converting the Polkadot to other cryptocurrencies or currencies. From the screenshot, we can see the trading volume as $2,390,011,312.
(Screenshot from coinmarketcap site)
Circulating Supply
Just as its name is, it represents the number of tokens in the public domain. This is dependent on the Issuance strategy used right from the ICOs to date which also covers it's a reward system to its validators. Polkadot Circulating supply is 987,579,314.96 DOT.
Total Supply
This is the summation of all token supplies released and the in the public domain but less the value of those that have undergone Token-Burn. The total supply for Polkadot stands at 1,103,303,471.
On-chain Metrics for Polkadot
These particular online metrics represent some of the in-depth analysis and operational status of the asset. This may include the following;
Volumes Deposited in Exchanges
In getting this value for the volumes in Exchanges, we can quickly harness it from coinmarketcap. We have the DOT listed on most top exchanges as observed from the screen. We have DOT on Binance, Huobi Global, Coinbase, Gate.io, KuCoin, Kraken, Bitfinex, etc.
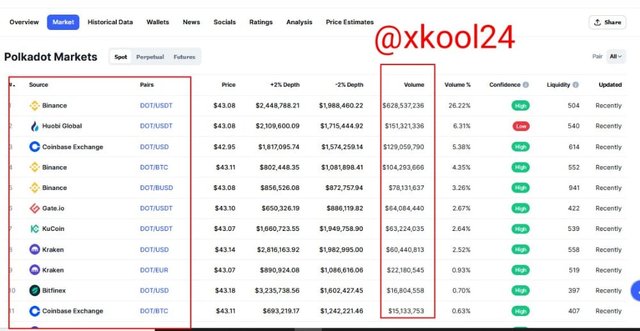
It also has trading pairs with the following coins, BTC, ETH, USDT, BUSD, EUR, USD, BNB, TRY, GBP, XBT, AUD, HUSD, KSM, etc.
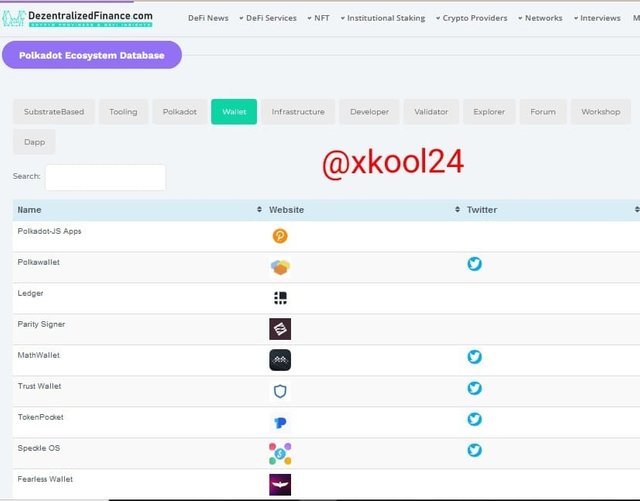
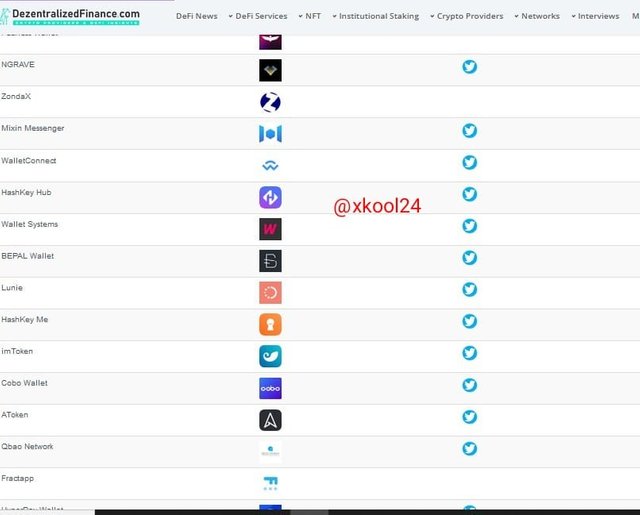
Number of Wallets created in Polkadot
In the Polkadot Ecosystem, it has created about 40 wallets on its protocol. This may include Polkawallet, ledger, part signer, math wallet, trust wallet, token pocket fearless wallet, etc.
3.) Make a purchase from your verified account of at least 10 USD of the currency selected in the previous point. Describe the process. (Show Screenshots).
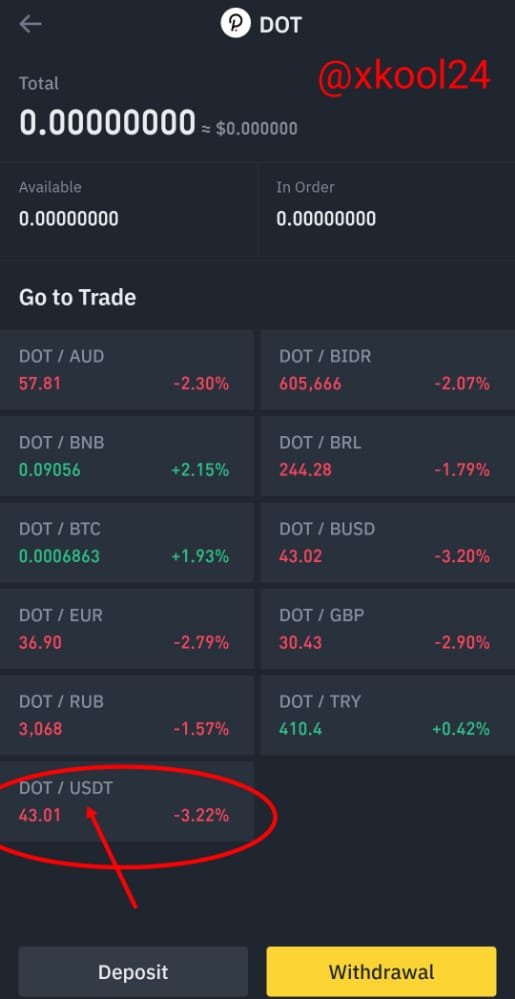
To make a Purchase of DOT Token in Binance
- Token used in the previous point was DOT
- I will be using my Binance Verified Exchange
- I will quickly click on the token pair which is DOT/USDT
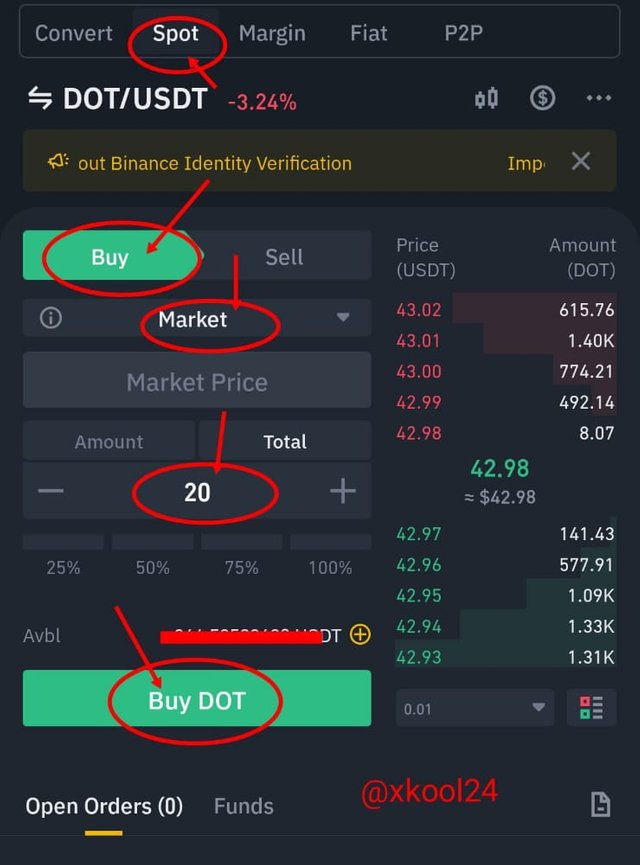
- Since I'm Purchasing DOT, I will click on the BUY option.
- Select the Market option
- Enter the amount of DOT to be purchased ($20)
- then click on the BUY button
4.) Apply Fibonacci retracements to the previously selected asset with a 4-hour time frame on the platform of your choice. Observe the evolution of the price at 24 and 48 hours, did it go up or down in value? Look to identify resistance and support levels. (Show Screenshots at 0, 24, and 48 hours of purchase where the date and time are observed).
In carrying out this task, I will be using my trading view platform for more user experience. To launch the interface, visit. I will be using the DOT/USDT pair for this illustration. And I will be affecting the 4-hour time frame in my settings.
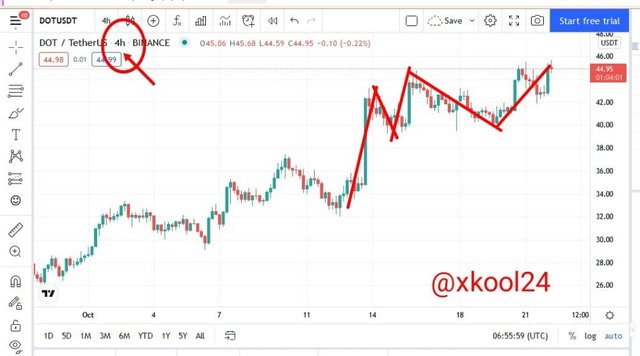
(Fig1: screenshot from tradingview site)
From the landing interface, we can derive from it that the market is on a bull run with Higher Highs and Higher Lows observed froits's a trend. Knowing the direction of the market is necessary before introducing the Fib Retracement indicator to guide your readings.
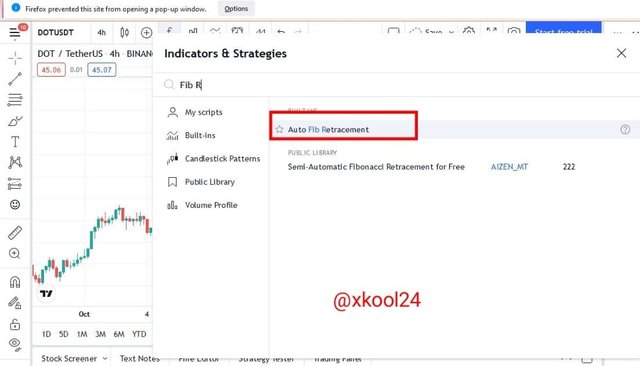
(Fig2: screenshot from tradingview site)
Therefore, I will be introducing the Fib Retracement indicator tool on the chart. Just click on the Fx feature on the top screen and then search and the indicator. From the screenshot, we can the HHs and HLs but if the recent HLs have not broken the previous HLs, it simply means the market is still on an upward movement.
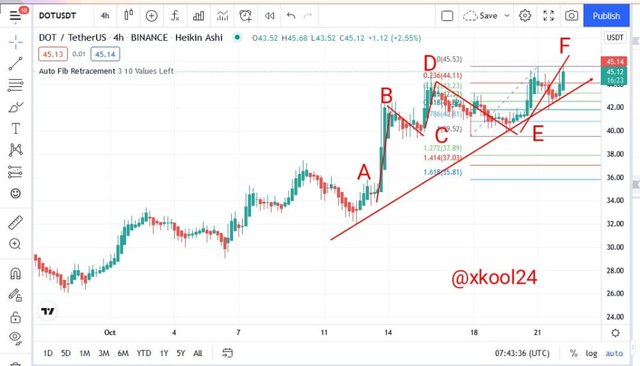
(Fig3: screenshot from tradingview site)
We can see from the screenshot that the price of DOT/USDT assets increased after 24hrs maintaining a Higher High trend. The initial higher high is $43.25 and the recent Higher High was observed at $44.54. This is about $1.29 profit for the DOT asset.
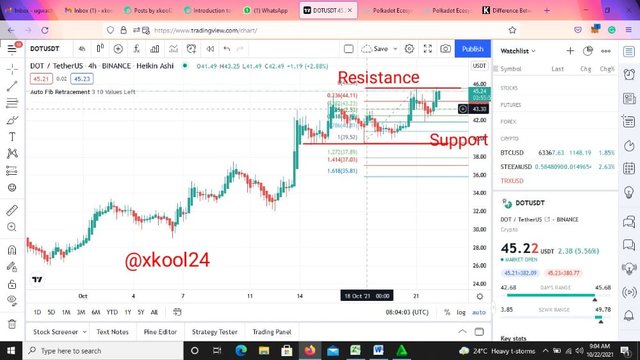
(Fig4: screenshot from tradingview site)
After 48hrs of Price movement, we observed that the price trend was at a higher low level of $39.63. This level was also observed to be a Support level for the price trend but the trend also made another higher high but now lower than the previous higher high level. This was captured at levels $43.30.
What are Bollinger Bands? How do they apply to Crypto Technical Analysis? With which other tool or indicator do you combine Bollinger Bands to analyze a Crypto? Justify your answer.
Bollinger bands are also an important technical indicator and investors' favorite trading tool that guides the most important aspect of Market trading. It is used to determine trade positions; Entry and Exit trade positions relative to scenarios bothering on Overbought and Oversold levels.
It is a widely used indicator in different markets like the forex, stocks, futures, and Cryptocurrency. This indicator was developed by John Bollinger sometime in the 1980s with an emphasis on bands that guide users on price movements and volatility.
Though using the Bollinger bands is a more simple trading indicator but usually places the trader at risky if not combined with any other trading indicator. This is observed by its ability to only dictate price volatility and hence be silent on all other market signals.
This indicator comes with three (3) lines with the middle line band using the Simple Moving Average, the upper line bands which are derived from using the middle line bands and adding twice of the standard deviation whereas the lower line bands are derived from using the middle line while you minus twice of the standard deviation. In simple terms, the upper and lower bands are deviation lines from the middle lines.
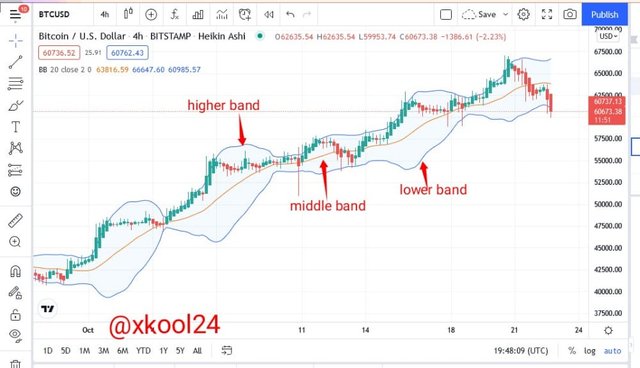
(screenshot from tradingview site)
Overbought and Oversold Signals in Bollinger bands
Another interesting strategy of the Bollinger bands is the Overbought and Oversold levels. When the price trend falls below the lower band level, this shows that asset is observed in the Oversold region and we are to anticipate market correction. When price trends approach and cross the upper band lines, this also shows an overbought scenario with a possible retest of trend reversals.
Bollinger bands with RSI Indicator
We are already familiar with the Bollinger bands Indicator that determines the trade positions of a given market as well as indicating overbought and Oversold levels when the price trend crosses the upper and lower band lines respectively.
While combining the Bollinger bands with the RSI, brings out more efficiency in its readings. Aside from determining the Overbought and Oversold levels with the crossing of the upper and lower Bollinger lines, the RSI also helps in its band's readings from 0 - 100.
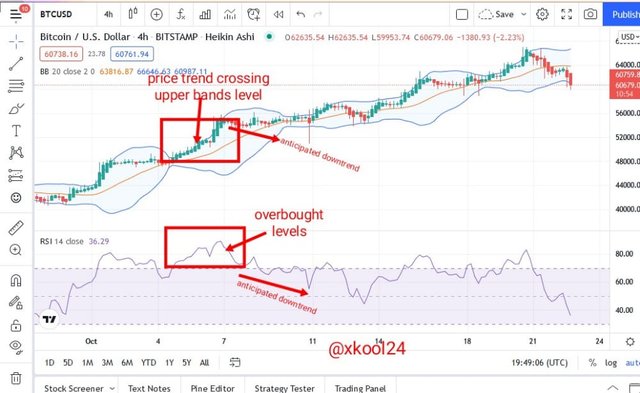
(screenshot from tradingview site)
When the RSI Indicator captures price movements approaching bands 30 levels and Crosses this line, it signifies an Oversold Signals and trader should anticipate a possible market reversal. Also, when Price movements are observed approaching bands 70 levels and crossing this line, it signifies an overbought signal with anticipated price corrections.
Conclusion
u
There is every need for traders/Investors to always get the Fundamental and Technical Analysis of any asset done before making any trade investment to avoid investing in an already dead coin. Though we can see long-term Investors going for the fundamental Analysis since it gives them the intrinsic value of an asset, the short-term Investors are technical analysis driven as chart analysis provides quicker and future price movements.
Polkadot Ecosystem emergence was timely as it provided the available platform for multi-build of Blockchain technologies. Developers through the Substrate can now build the Blockchain on this protocol and hence improve Interoperability and the required interaction (transaction and transfers) amongst all connected Blockchains.
Thank you Prof @imagen for your lessons this week.
Need time to digest these informations. Anyway thanks
Gracias por participar en la Cuarta Temporada de la Steemit Crypto Academy.
Continua esforzandote, espero seguir corrigiendo tus asignaciones.