Crypto Academy / Season 3 / Week 2 - Homework Post for professor @cryptokraze- Market Structure Break (MSB) Strategy to Trade Reversals.
Hello great friends of Advance levels, quite interesting participating in the class and homework task as richly presented by Prof @cryptokraze on Market Structure Break Strategy to Trade Reversals. Lets head on as I lead the way...
What do you understand about Market Structure?
The concept of market structure is to allow for a holistic appraisal of price movements during market activity which is gear towards either making profits or reducing Losses. Due to the high instability seen in the cryptocurrency trade with market trends seen to move at uneven directions at a given time and the opposite direction, the concept of market structure is to create a consciousness in the trader to be proactive instead of reactive while observing some patterns seen during trading.
Therefore, the Market structure concept allows the trader to act based on the market trend and pattern observed during trade which leads him more to the path of profiteering. Due to the instability seen, we may either have Market Structure for Uptrend or for Downtrend. Often a times we may see trade gather to near equilibrium without necessarily making either of the uptrend or downtrend. Just like what is seen in the Wyckoff's Concept of trading where market activities during the Accumulation or distribution phases are captured in the sideways movement.
I will be showing us what it looks like demonstrating a Market Structure using both trends (Uptrend and Downtrend).
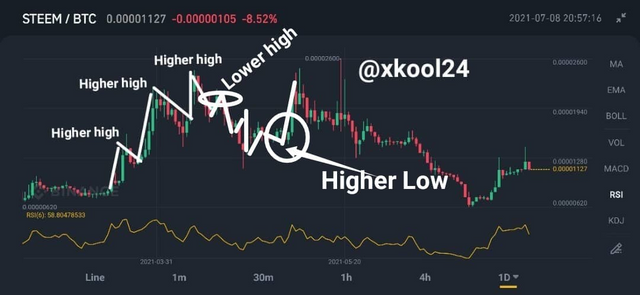
In this concept for Uptrend, when prices of an asset gets bullish, the current upward trend is seen to be higher than the previous high attended and this happens in a sequence until trade tends to correct itself by making an initial Higher Low. In the sequence of a higher high seen in occurrence in a Market Structure for an Uptrend, so do we see a change of Resistance becoming Support at this intervals.
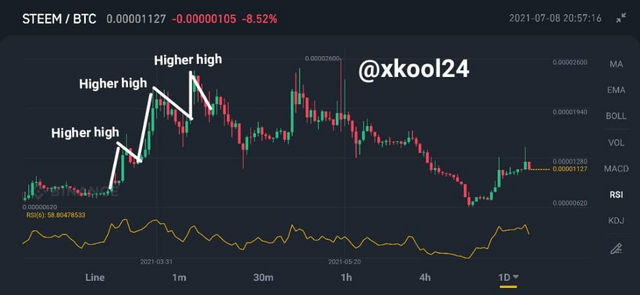
(Screenshot_Higher high)
Just as simply demonstrated for the uptrend, this is the opposite for a downtrend Market Structure. In this case when prices of a given asset becomes bearish, the price trend trend at each interval is seen to be lower than its former or previous low trend. This is what we can refer to as Lower Low trends. This time Supports becomes Resistance for the given intervals witnessed for this Lower Low trend.
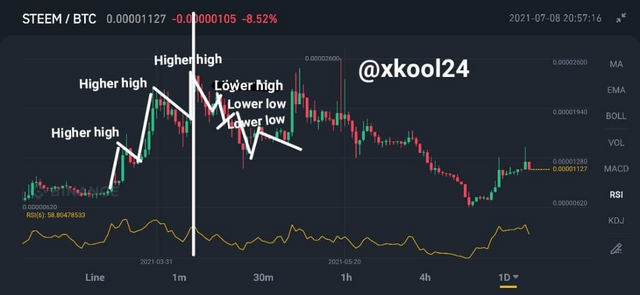
(screenshot_Lower low)

What do you understand about Lower High and Higher Low? Give Chart Examples from Crypto Assets.
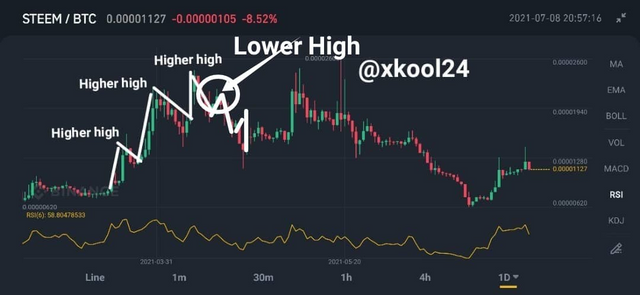
Just I have illustrated the Higher high and Lower low trends, the Lower high was still caught in the screen screenshot above. But will be doing an overview of the both Market trend.
I will try to explain this in a more simpler way. We cannot talk about Lower Higher without passing through the Higher High. In the market situation where there is an evident bullish trend, this is not expected to continue forever as market is seen to correct itself and make reverse its uptrend at a while. This particular move that sees the reversal of market uptrend brings about a point where the next high trend attained is lower that the previous high instead of been higher than it as seen before its occurrence. When this happens we say a Lower High has occurred. See the Screenshot below for more practical illustration.
I will be using the same illustration just as I did for the Lower High trend. The Higher Low on the other hand is seen to occur when a trend has just passed through a sequence of trend called Lower Low. In this case trade would not continue to follow the downtrend forever, hence the point where a correction or reversal is seen to birth is what gives the emergence of the Higher Low. This simply means that at the recent Low that should be lower that the previous Low is to be higher than the previous low and hence making it Higher Low. See Screenshot below for more practical illustration.
How will you identify Trend Reversal early using Market Structure Break? (Screenshots Needed)
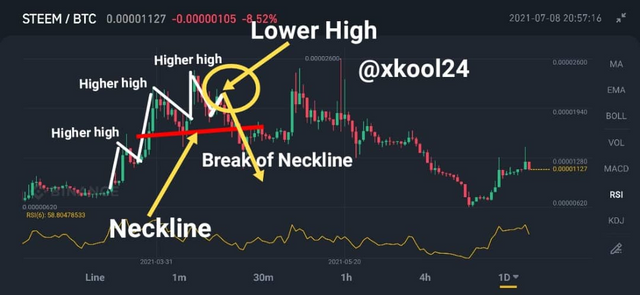
From my explanation so far from activities of the Higher High and Lower Low in a market and the occurrence of the correctiveness of the trade be it Uptrend or Downtrend gives an early signal of a possible Market reversal. Identifying a Trend Reversal quite early in a Market Structure Break can be perceived as soon as we identify the first appearance of a Lower High and Higher Low for an Uptrend Trade and Downtrend Trades respectively.
In this case the when we identify the Lower high point after the activities of the Higher High sequence, there is a likelihood of a market reversal. This is also accompanied with the presence of a neckline which i also tag as support base of the trend, when spot on the Lower High point and Neckline, there is a high possibility of a break in the neckline/Support which significantly shows a market reversal. As an smart trader we are expected to be more of Proactive in decision making as soon we see the Lower High so as to prepare for a sell/exit positions than been Reactive and caught unaware and unprepared.
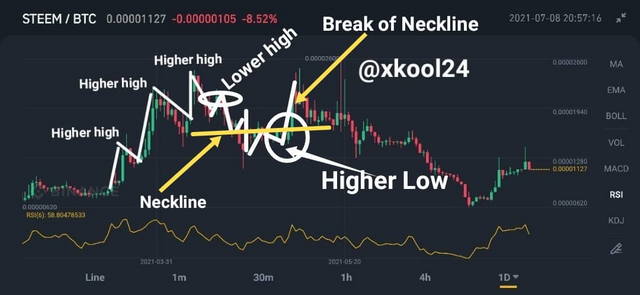
Just as mentioned, Trend Reversals can also be identified during a Downtrend and this can be figured out after a series of Lower Low trends and sequence captured in a trade. Since a particular kind of trend is expected forever, there are tendencies of market correction which is called market reversals. The early stage in this trend is seen immediately when the Higher Low is observed. This prepares the trader against the next line of market trend. Market Neckline is also observed due to there would be a possible Neckline break. At this point, Traders are seen to make good entry positions into trade against possible uptrend and profits margin taken. Find screenshot below for more illustration.
Explain Trade Entry and Exit Criteria on any Crypto Asset using any time frame of your choice (Screenshots Needed)
The Trade Entry Criteria works perfectly well when we are able to identify the different spot zones for the Lower High and Higher Low for our Uptrend and Downtrend trades respectively. This both spot zones simply identifies our buy and sell entry criteria while engaging the trade. I will be making some illustrations with a given Crypto assets for proper knowledge.
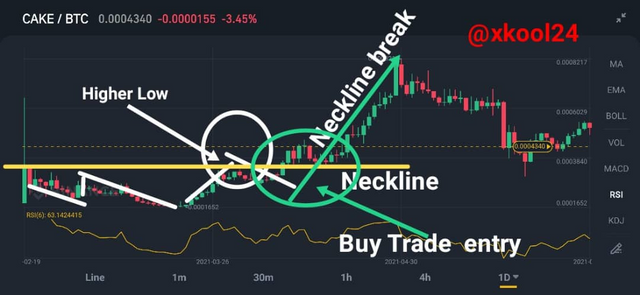
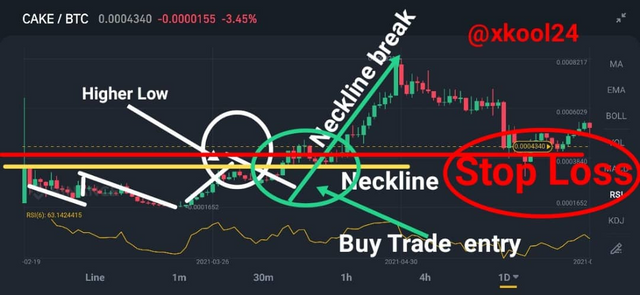
**The Buy Trade Criteria **: This is simply means the buy entry position of the trader when price assets is seen to be at its low. At this point the activities of the Lower low sequence must have winded up with a possible emergence of a Higher Low which prepares the trader for a break in Neckline and uptrend movement. At this point, the trader best buy position is between when he notices the Highest Low and the Break of Neckline.
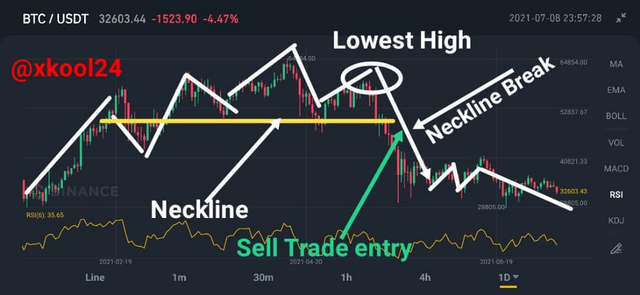
The Sell Trade Criteria: Just like what was narrated for the Buy Trade entry, the Sell Trade entry is that position that must have seen the activities of the end of the Higher High sequence and hence the occurrence of the Lowest High. At this point the trader should be able to decode a possible market reversal by identifying the Neckline and possible break of Neckline which tells him to better make a Sell Trade entry. So the trader is at its peak to make Sell Trade Entry between the point of the Higher Low position and when the trend breaks the Neckline. See screenshot below;
Making a Trade Exit Criteria positions when in Profit and Loss is a two thing that determines how best to use the Take Profit tool and Stop Loss tool respectively. This implies that the both tools are seen to be place at those positions where market is likely to start reversing itself. This may include the Lower High and Higher Low positions respectively.
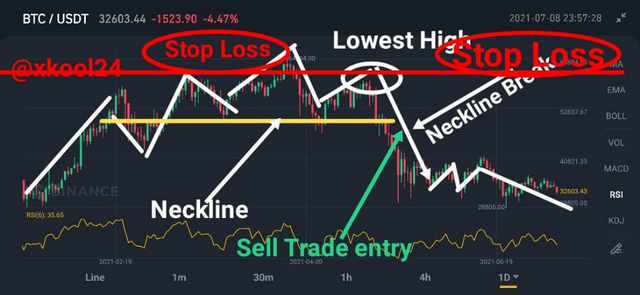
When in the Loss positions vis-a-vis using the Stop loss tool, the trader is expected to know how well to place the Stop loss for an Uptrend (Sell positions) and downtrend(Buy positions) trade accordingly. For the Sell entry positions, the Stop loss is seen to be placed at the Lowest High point whereas for the Buy entry positions, the stop loss is placed at the Higher Low points.
(Using the Stop loss for buy Position while in Loss)
While using the TAKE PROFIT tool too, this is also applicable to the positions placed as seen for the stop Loss. The Take Profit is place at the Lowest High spot for SELL positions and at the Highest Low for the BUY positions respectively.
(Using the Stop loss for Sell Position while in Loss)
Place 2 demo trades on crypto assets using Market Structure Break Strategy. You can use lower timeframe for these demo trades (Screenshots Needed)
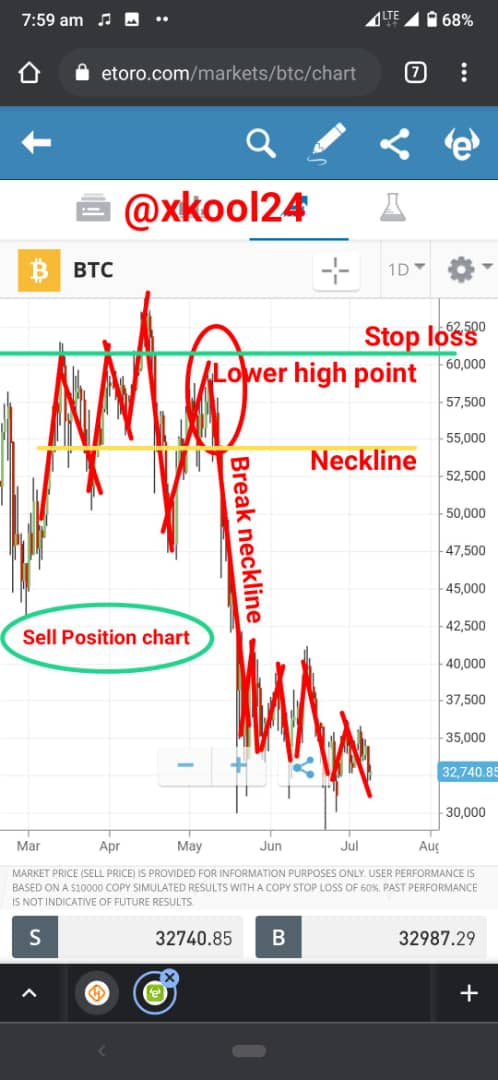
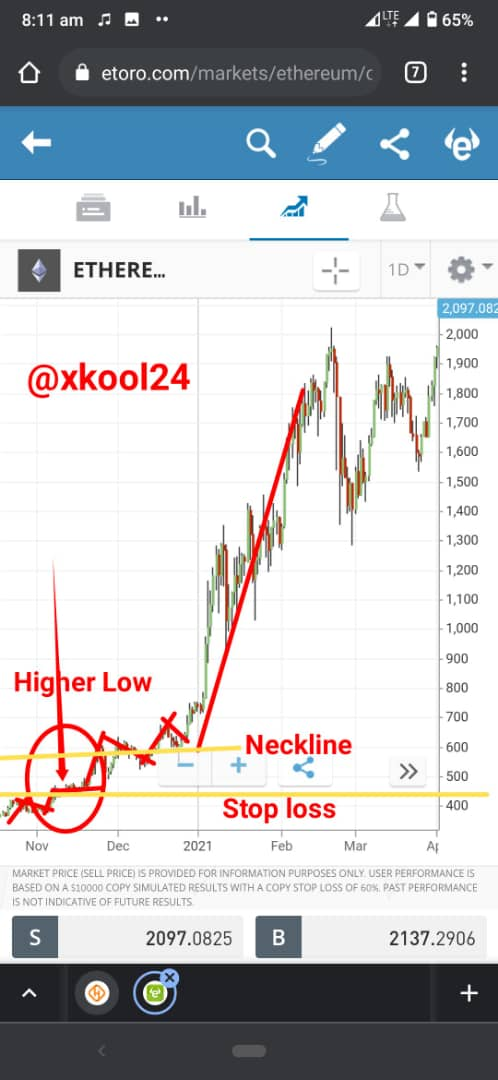
This is a typical screenshot from the eToro demo trading for BTC and ETH which reprsents the Sell and Buy entry positions respectively. The chart for the ETH was able to show capture the Higher Low spot which invariably signifies the position for possible Buy entry Criteria for this asset. We also see the Stop loss placed at the Higher Low point.
For the Sell Entry position, this was captured for the BTC with the emergence of the Lower High spot which also signifies that the stop loss should be placed this spot. The Trader profit zone is sen between the Lower High spot and before the long break Neckline that sees a downtrend movement.
CONCLUSION
The Market structure is a consensus of price action for a given asset that guides the activity of a trader which makes him more proactive than reactive in handling trading activities.This overall price action can be uptrend or downtrend with both Buy and Sell entry positions and Stop loss and Take Profit positions.
Thank you all for reading through my post.