Japanese Candlestick Chart - Steemit Crypto Academy Season 4 - Homework Post for Task 10
Hello everyone,
Now lets take a look at the task at hand and the questions that comes with it...…
QUESTION 1
A) Explain the Japanese candlestick chart? (Original screenshot required).
B) In your own words, explain why the Japanese Candlestick chart is the most used chart in the financial market.
C) Describe a bullish and a bearish candle. Also, explain its anatomy. (Original screenshots required)
A) Explain the Japanese candlestick chart? (Original screenshot required).

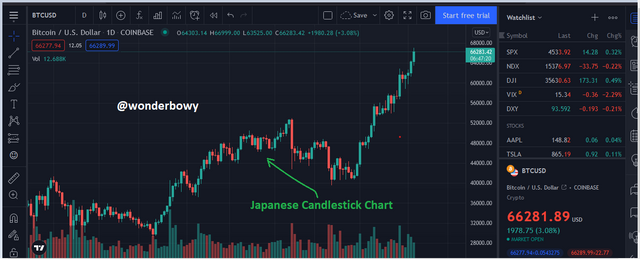
Screenshots from trading view
As we all know, crypto charts are the graphical representation of any assert on the market in relation to price changes. This gives the an insightful knowledge to the trader on the next move to make in order to maximize profit. There are lots of these price charts, one of them happens to be the Japanese Candlestick Chart.
The Japanese chart is a type of candlestick which was developed by a Japanese rice trader who goes by the name Munehisa Homma. He invented this chart around 1700s to help describe the price pattern of an assert. Munehisa Homma is sometimes recognized as the father of candlestick chart.
The technical indicator or chart is able to provide an in-depth description of price pattern on the crypto market. One of its special abilities is to be able to predict future price changes and trends. Therefore, it assists the trader to do technical analysis in order to know the market trend and possible entry points. No wonder it is one of the most used chart in the crypto market.
B) In your own words, explain why the Japanese Candlestick is the most used in the financial market.
For something to be greatly accepted by vast number of people, then it means it has some special advantages that comes with its usage. This same reason applies to the Japanese candlestick chart. Let me take you through some advantages or special abilities that comes with the usage of the Japanese Candlestick probable over the others.
Its ability to provide more detailed information about price actions and trends is a key factor. As I made mention of earlier on is how it can give future prediction of price trends.
When it comes to trading, it is very necessary to know the current state of the market. With the help of the Japanese Candlestick, a trader can easily tell the current situation of any crypto assert at a glance. This is due to it clear graphical representation as said earlier on.
The trader is able to notice the direction at which the market is moving or will move next. This can be done by just taking a look at the shape and colour of the candlesticks. This will help a trader know if its an uptrend or downtrend depending on the formation of either a bullish or bearish candlesticks.
This candlestick can help a trader with the quick identification of market patterns quickly. The bullish and bearish reversal patterns that comes with the use of the Japanese Candlestick makes it easy for a trader to quickly identify market patterns easily.
C) Describe a bullish and a bearish candle. Also, explain its anatomy. (Original screenshots required)
Candlesticks comes in two in two major components which are the BULLISH and BEARISH. Let's take a look at both of them...…
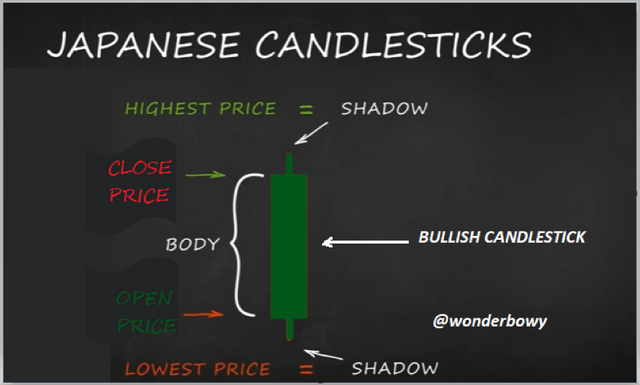
BULLISH
It's a candlestick which signals an uptrend in the market. It is usually green in colour and follows a particular uptrend movement. That is the increase in price of a particular crypto assert is displayed by the Bullish Candlesticks. Therefore, whenever there are bullish candles formed it's an indication of increase in price of a particular crypto assert. There could be continuous increase in the price for a period of time thus displaying a number of these candle sticks until it hits it's peak.
The BULLISH CANDLESTICKS can be divided into various parts which are;
OPEN; This is the very first price indication of a crypto assert on the bullish candlestick within a particular period of trading timeframe.
CLOSE; After the bullish has attained an open for a particular period of trading timeframe lets take for example 3 minutes, the last price before the candle jumps to another price is termed as the close.
LOW; This is actually the part of the candlestick where there is the lowest price record with a particular trading timeframe.
HIGH; This part of the candle also shows the highest record of price within a particular trading timeframe of a crypto assert.
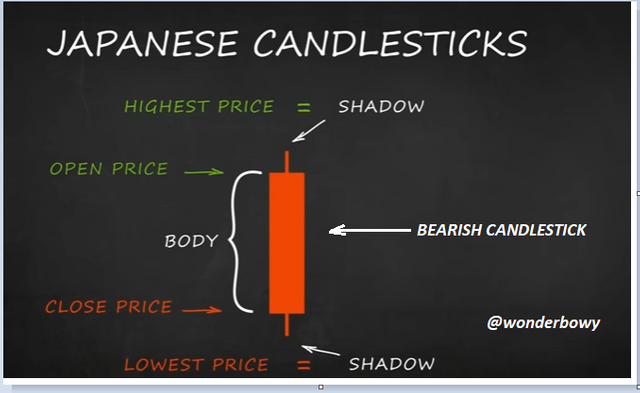
BEARISH
Usually red in colour is a type of candlestick which tells a fall in price of a crypto assert. Meaning a decrease or fall in an assert over a particular trading timeframe is indicated by a bearish candlestick. This candle tells a possible downtrend in the market which is a signal for a possible exit.
The same way the BULLISH CANDLESTICKS have parts so does the BEARISH. Although same as the bullish in meaning different in direction. Let take a look at them.
OPEN; this is also the beginning of a bearish price trend within a specific trading timeframe on the market.
CLOSE; happens to be the point where the bearish candlestick marks a close or end the price trend within a specific trading time period.
LOW; also represent the lowest price record of the bearish candlestick within a specific trading period.
HIGH; is the highest price point of the bearish candlestick within a specific trading time frame.
From the two screenshots above, we can see also both of these candlesticks have the shadows and real body of which the SHADOW illustrates the unsettled movement of price on the chart. That is to say areas that price moved to but could not attain a complete point, It could probably be a flash.
On the other hand, the REAL BODYis the portion or distance covered by a price range within a particular period of time, normally the distance between the closing price and the open price.
Although most of the trading sites have red and green as their default colors for the candlesticks, there are some which are black and white or can be set to different colours by the trader.
Thanks to prof @reminiscence01 for such an insightful lectures on the Japanese Candlestick Chart. Its such an technical analysis tool that every trader needs to know about. It comes with some special features which I have made mention of earlier and if most traders around the world uses this chart then you can just imagine how good it is. I will advice every trader out there to give it a try one of this day if they have not yet given a try.
Thank you.