HOME WORK by @wonderbowy for @kouba01 : Steemit Crypto Academy Season 2-Week6 | Cryptocurrency Trading with MACD indicator
Hello fellow steemians, it is yet another week of great teachings, I really enjoyed this week’s class. To be precise that of prof @kouba01, lot have been acquired through your teachings. I am here to present y homework task and hope you like it. Now lets go straight into this weeks tasks.
• What is the MACD indicator simply?
It’s simply an acronym which stands for Moving Average Convergence Divergence which happens to be one of the technical indicator oscillators, a tool used by traders based on the convergence and divergence of several averages. It helps in tracking price events, mostly ones that have already occurred. Meaning it focuses meanly on data that has happened in the past.
Many traders utilize this indicator to be able to measure and to predict market price trends. This helps many traders in founding the best time to enter the market and the best time to exist.
• Is the MACD Indicator Good for Trading Cryptocurrencies?
Well from the knowledge acquired from the class, I will say it is good for trading since most traders uses it to predict the market price. Also unlike other indicators, MACD has other simpler indication system that can allow any one at all do trading.
Just that applying only the MACD in analysis might not be enough when trying to maximum profit as a trader. Other indicators need to be employed as well so you can compare and make better decisions.
But in all I will say it’s very good indicator and should be used by traders.
• Which is better, MACD or RSI?
When it comes to trading there is nothing like 100% profit making indication, anything can happen but when you have a suggestion from a third party you get higher hope of winning and making more profit than loses.
And to trust the third party on decision making depends on what it brings on board. And comparing MACD with RSI concerning what each is able to offer I will prefer MACD to RSI.
The reason being, MACD is simpler to manipulate and a better way of showing profit maximization points. That is if the there is an intersection, it’s a signal of either to buy or sell depending on where the intersection takes place. Below the zero-line calls for a sell whiles above the zero line calls for a buy. Anyone new to trading can easily understand this basic concept.
• How to add the MACD indicator to the chart, what are its settings, and ways to benefit from them? (Screenshot required)
Below are the steps involved in adding an MACD to a chart.
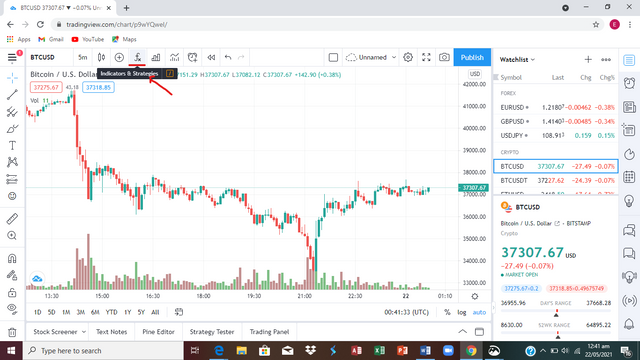
STEP 1. CLICK ON THE INDICATORS AND STRATEGIES ICON
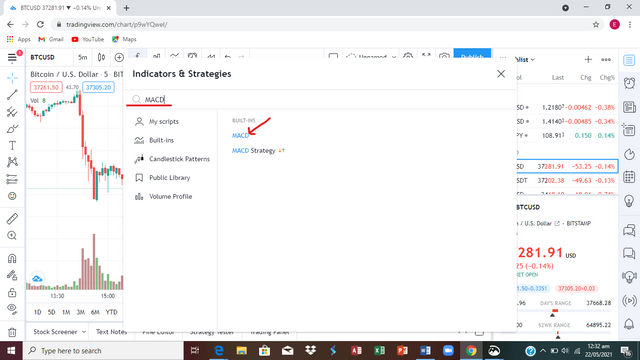
STEP 2. SEARCH FOR MACD IN THE SEARCH BOX AND SELECT FROM THE OPTIONS.
MACD ADDED SUCCESSFULLY
CLICK ON THIS BUTTON INCASE YOU WANT REMOVE MACD FROM YOUR CHART.
The steps below will help in manipulating the MACD indicator to your preferred desire.
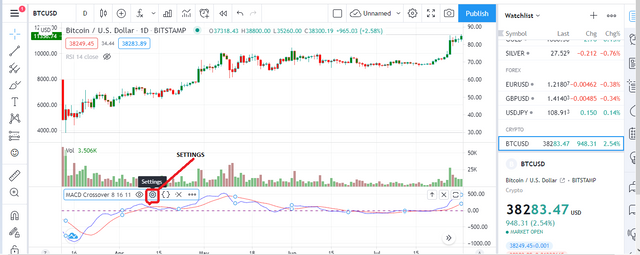
STEP 1. CLICK ON THIS BUTTON TO SET THE MACD.
STEP 2. CLICK ON EITHER INPUTS OR STYLE
MACD SETTINGS..
It has two basic components as mention above. lets take a look at them;
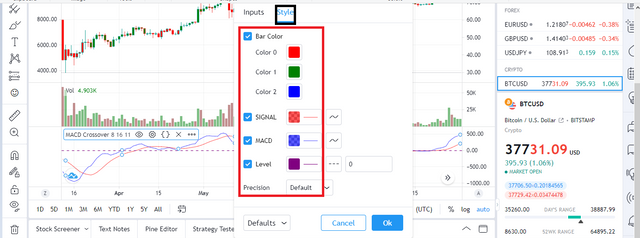
- STYLE
--
This is mainly the appearance setting. it got to do with how you want your chart to look like, in terms of colors of the various lines, namely the HISTOGRAM, MACD, SIGNAL....
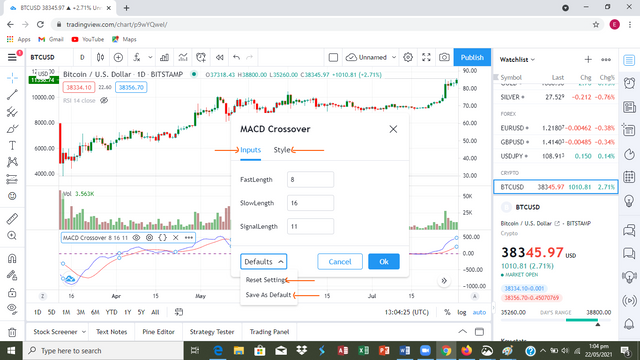
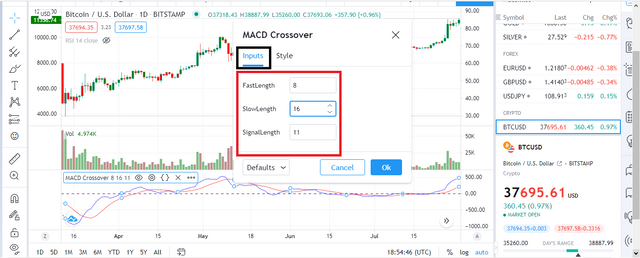
- INPUTS
--
This got to do with the configuration and calculations of the MACD. The default values are in the picture below. In case you are not sure of what you are about to do just leave them in the default settings to stay on the safer side.
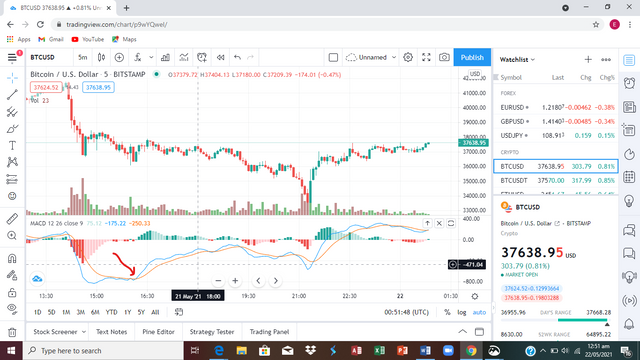
• How to use MACD with crossing MACD line and signal line? And How to use the MACD with the crossing of the zero line?
Making good profit with MACD comes with how you understand the signals that are created.
You need to also know how them as well. Below is a diagram of MACD and Signal line crossing also the Zero Line.
** SIGNAL LINE AND MACD CROSSING**
From the diagram above, whenever the MACD crosses the Signal Line from below it suggest you buy. At this point, its an indication that prices are likely to increase and the best time to buy is now. When the MACD line crosses the SIGNAL LINE from above it suggest you sell at once. At this point its an indication that prices are going dip.
If you position yourself well using the MACD and the SIGNAL LINE some good profit could be made.
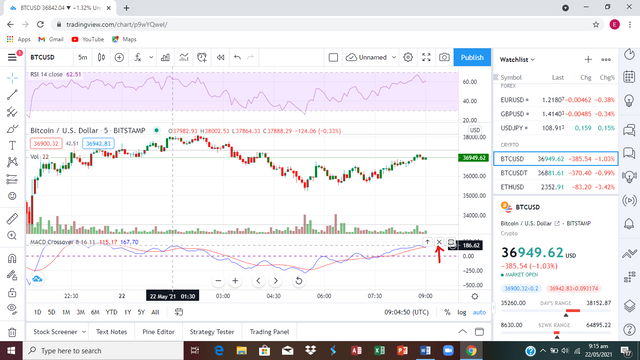
• How to detect a trend using the MACD? And how to filter out false signals? (Screenshot required)
--
MACD can be used to determine positive signals just as other indicators. One of the tools for determine a trend is the histogram. Predicting a market reversal with this tool is very helpful in making decisions. Thanks to the MACD decision making is easier.
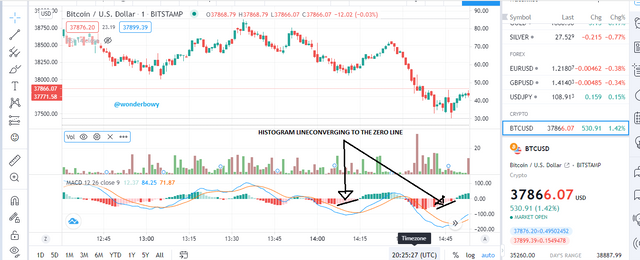
** HISTOGRAM AND ZERO LINE DEPICTING A TREND**
Basically there are two ways of detecting FALSE SIGNALS and they are;
1 Bullish Divergence
2 Bearish Divergence
I will elaborate on the two but first let’s look at what FALSE DIVERGENCE really is. It’s when the set indicators tell something way different from the main indicator or market trend. This happens in the process of trading and if care is not taken you might make huge loses.
Now back to our types of FALSE DIVERGENCE, let’s take a lot at the first one which is;
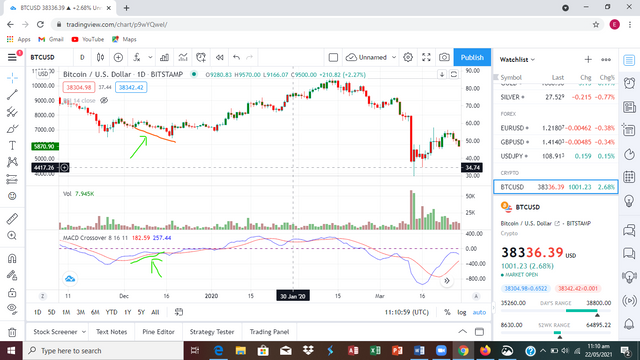
BULLISH DIVERGENCE; it is when the MACD chart is showing an increase in price whiles the ACTUAL CHART shows a decrease in the price.
It’s not easy to detect unless you are vigilant. Below is a picture of how it looks like.
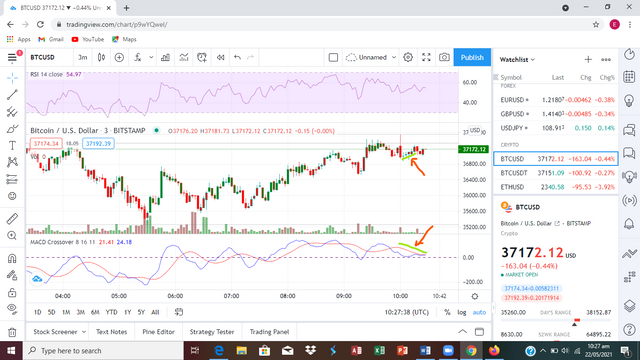
Now to the second one which is BEARISH DIVERGENCE; it is when the MACD indicator show a decrease in price whiles the ACTUAL CHART shows an increase in price also shown in the picture below.
• How can the MACD indicator be used to extract points or support and resistance levels on the chart? Use an example to explain the strategy. (Screenshot required)
Support and Resistance in trading is basically an indication of where the price hits a point where it might not continue in its possible direction, meaning after a dip or continues increase the chart might take a different move. Surely what goes up must come down and what comes down must surely go up when it comes to trading. Either the price goes up or comes down
As we all know crypto currencies are volatile in nature and therefore are not stable. This usually brings about the rise and fall of this currencies. From that we have what we refer to as resistance and support. So lets take a look at the two.
SUPPORT
Support is simply a point where an asset/cryptocurrencies stops dipping and then takes a different path all together. Thus start rising in price after the dip. Mostly all price fall are not below the support price index.
RESISTANCE
Its a point where increase in price stops leading to a decrease in price.
That same way MACD can be used to predict the resistance and support of the assets. mostly when there is a very strong momentum, there is a thick producing candle sticks. When there is momentum its very good because it can either lead to a reversal in price or lead to a strong candle sticks.
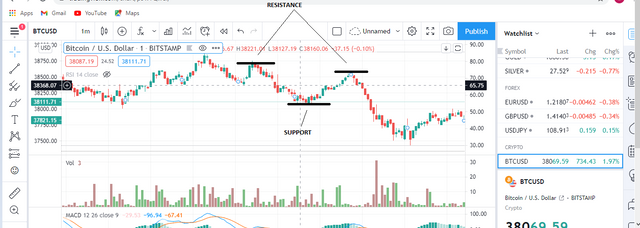
MACD SUPPORT AND RESISTANCE
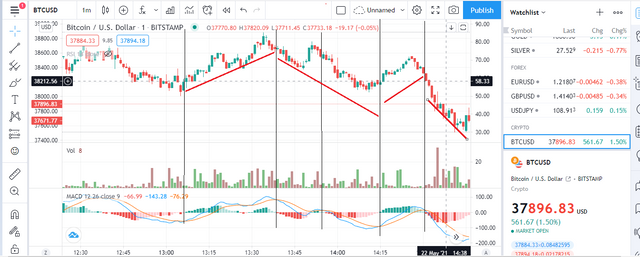
• Review the chart of any pair and present the various signals from the MACD. (Screenshot required)
Below is a review on the pair of BTC/USD chart. From todays lesson we were made to know that when MACD crosses over the line it is suggest a buy but when the candle is small on the histogram it tells a different story all together. This is an indication that the momentum is weak and not strong. When there is a rise in price with a rise in momentum, a trader becomes comfortable with trade.
When the green light becomes lighter, its an indication of drop in momentum and for that matter we should be expecting a resistance. This is a sign that price will fall and we should sell at that point. Be mindful of how you trade, its not always that you should wait for the indicator before making a move. Sometimes make your own fundamental analysis and make a move.
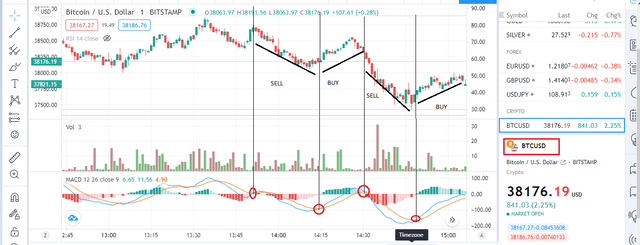
BTC/USD CHART REVIEW
MACD is a very good indicator and should be employed by every individual who is new or old in the trading sector or business. This indicator is very easy to interpretate and manipulate.
It helps reduce the risk of huge losses as well. Although not 100 % assured but its very helpful.
Finally, I will like to say a very big than you to @kauba01 for such as insight into this week’s class on MACD indicator. More grease to your elbow prof.
Thank you.
Hello @wonderbowy,
Thank you for participating in the 6th Week Crypto Course in its second season and for your efforts to complete the suggested tasks, you deserve a 6/10 rating, according to the following scale:
My review :
A generally accepted article whose answers lack analysis of important aspects such as the role of the MACD indicator in identifying resistance and support level. Try to dig deeper into the answer.
Thanks again for your effort, and we look forward to reading your next work.
Sincerely,@kouba01
Hello thanks @kouba01 for the review and the marks but I generally think your question comes in so many forms.
just 1 question could contain like 4 sub questions making it very easy to miss a question. Anyway will pay much attention to it in the next task.
THANKS.