Crypto Academy / Season 3 / Week 7- How to create an account on TradingView, how to use indicators,tools, features of tradingview: Homework Post for Professor @yousafharoonkhan Done By @wonderbowy
This weeks lectures was such an interesting one. I really enjoyed your class @yousafharoonkhan, keep up with the good work. I have actually learnt a lot from your lectures and I am very happy to take part in your task.
Here is my submission for the task given. Lets go straight into action...............................................................
Question no 1
Defining the TradingView site and how to register an account in tradingview? what are the different registration plan? (screenshot necessary)
TRADING VIEW
- Trading View is simply one of the platforms used by investors in making fundamental and technical analysis before making any decisions concerning the investment of a particular asset. When it comes to Technical and Fundamental analysis making, trading view is an exceptional platform to adopt. It also has a social media platform where investors can interact, share their thought on some analysis and acquire knowledge from each other. Trading view is a fantastic platform to use in order to maximize profit as a trader or investor.
HOW TO REGISTER AN ACCOUNT ON TRADING VIEW
- Talking of how good trading view is, one needs to create an account in order to use it and that's what I am going to show you in this section with the aid of screenshots. Some important factors to consider before creating an account on any platform is to know the website of that particular platform.
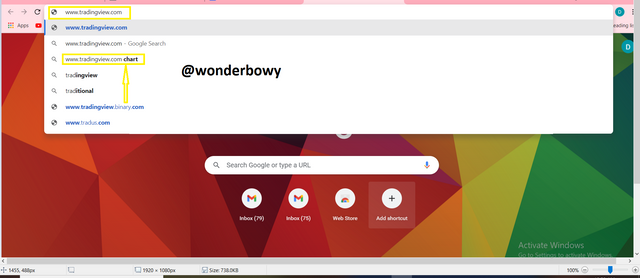
STEP 1 SEARCH www.tradingview.com ON YOUR BROWSER..
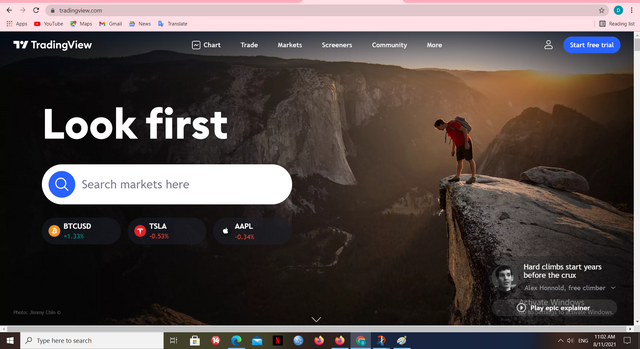
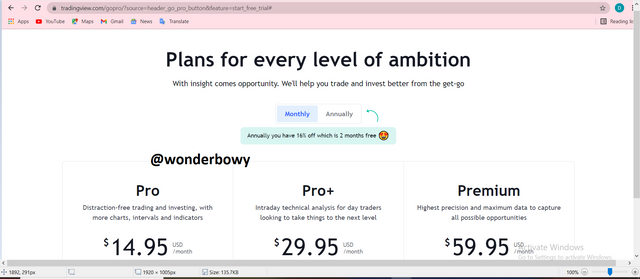
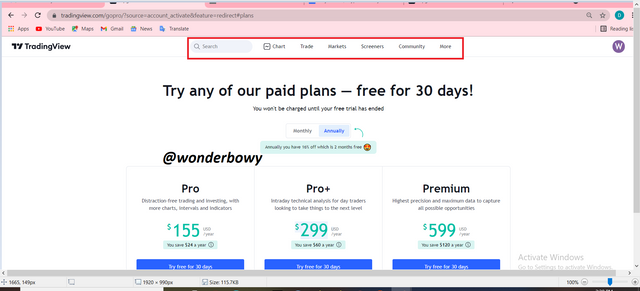
STEP 2 THIS IS HOW THE WEBSITE LOOKS LIKE AFTER A SUCCESSFUL SEARCH DISPLAYING ALL THE VARIOUS USAGE PLANS( YEARLY, MONTHLY AND FREE TRIAL)
,
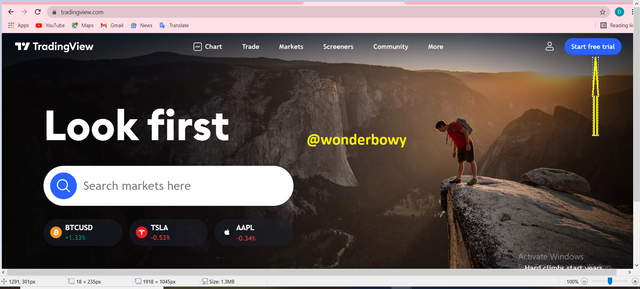
STEP 3 CLICK ON START FREE TRAIL
STEP 4 CHOOSE ANY OF THE PLANS SUITABLE FOR YOUR USAGE.( MONTHLY AND YEARLY )
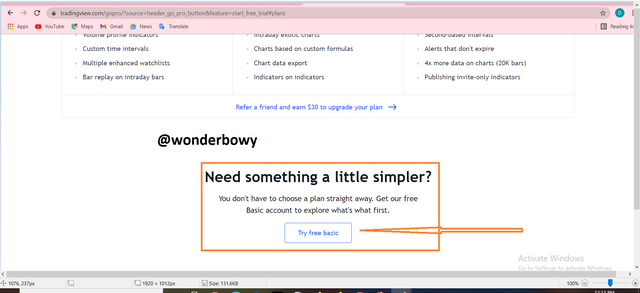
STEP 5 CLICK ON TRY FREE BASIC IN CASE YOU WANT TO EXPLORE TRADING VIEW BEFORE PAYING FOR ANY OF THE COMPENSATION PLANS.
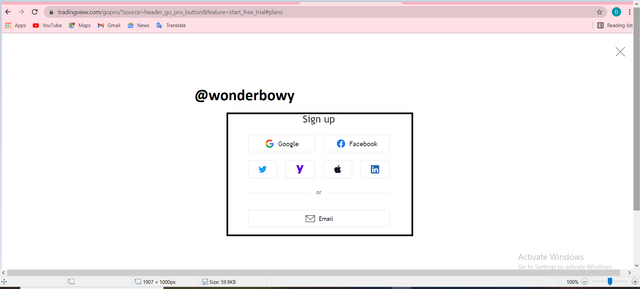
STEP 6 CHOOSE FROM ANY OF THE WAYS SUITABLE TO REGISTER WITH ( EMAIL, FACEBOOK, TWITTER, GOOGLE, YAHOO, APPLE ID, AND LINKEDIN )
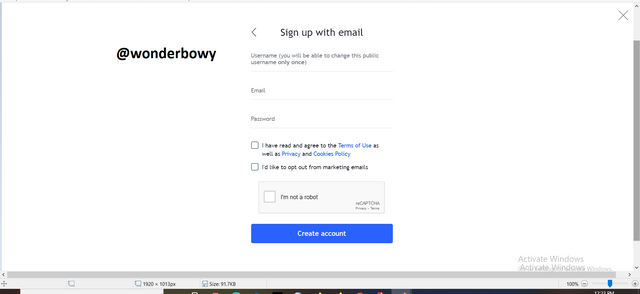
step 7 I CHOSE REGISTRATION THROUGH EMAIL. ENTER YOUR DETAILS IN THE VARIOUS SPACES PROVIDED AND CLICK ON CREATE ACCOUNT
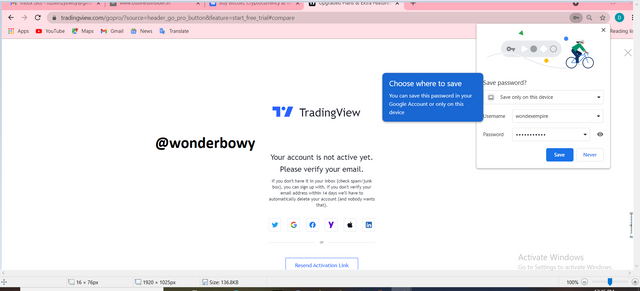
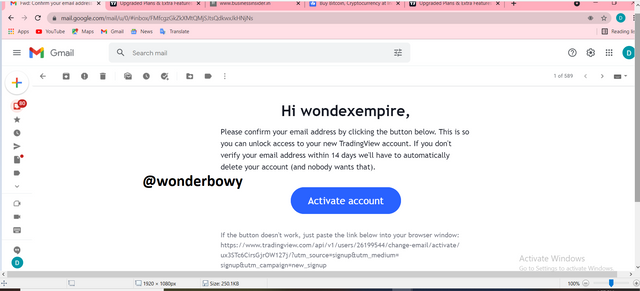
STEP 8 CONFIRM EMAIL VERIFICATION TO ACTIVATE ACCOUNT
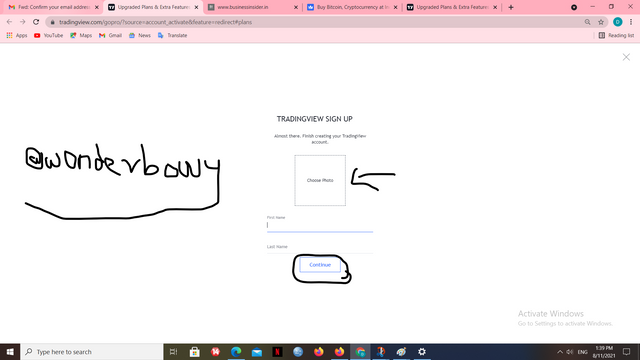
STEP 9 AFTER EMAIL VERIFICATION THE NEXT THING IS TO ENTER YOUR DETAILS WHICH INCLUDES FIRST NAME AND LAST NAME. YOU CAN ADD A PROFILE PICTURE AS WELL.
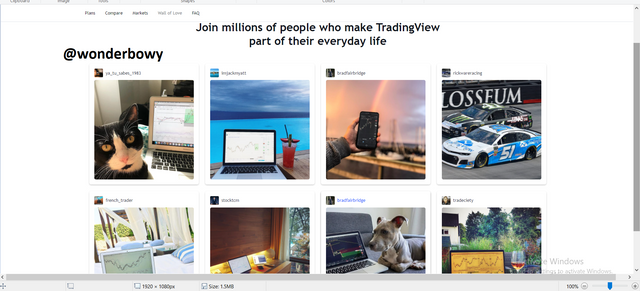
STEP 10 ACCOUNT CREATED SUCCESSFULLY, THIS ARE SOME USERS OF THE TRADING VIEW PLATFORM YOU CAN INTERACT WITH.
- Basically there are two major registrations plans when it comes trading view.
1 MONTHLY PLANS; Under the monthly plan we have ;
- Pro ( 14.95 )
Key benefits one enjoys under the Pro:
5 indicators per chart
2 charts in one window
20 server-side alerts
Ad-free
Volume profile indicators
Custom time intervals
Multiple enhanced watchlists
Bar replay on intraday bars
- Pro Plus ( 29.95 )
All the benefits one enjoys under Pro, plus:
10 indicators per chart
4 charts in one layout
100 server-side alerts
2 devices at the same time
Intraday exotic charts
Charts based on custom formulas
Chart data export
Indicators on indicators
- PREMIUM ( $59.95 )
The complete package, with its benefits:
25 indicators per chart
8 charts in one layout
400 server-side alerts
5 devices at the same time
Second-based intervals
Alerts that don't expire
4x more data on charts (20K bars)
Publishing invite-only indicators
2 ANNUAL REGISTRATION PLANS
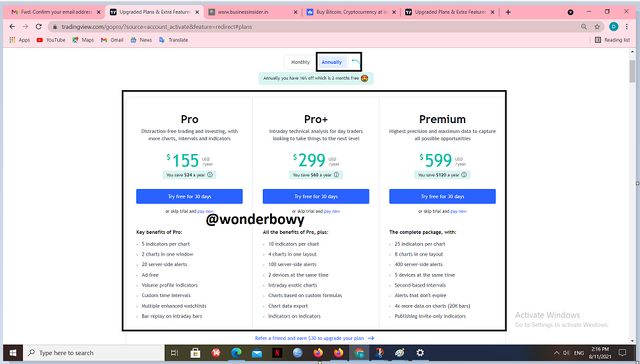
- Pro ( $155 )
Key benefits one enjoys under Pro:
5 indicators per chart
2 charts in one window
20 server-side alerts
Ad-free
Volume profile indicators
Custom time intervals
Multiple enhanced watchlists
Bar replay on intraday bars
- Pro plus( $ 299.00 )
All the benefits of Pro, plus:
10 indicators per chart
4 charts in one layout
100 server-side alerts
2 devices at the same time
Intraday exotic charts
Charts based on custom formulas
Chart data export
Indicators on indicators
- Premium ( $599.00 )
The complete package, with its benefits:
25 indicators per chart
8 charts in one layout
400 server-side alerts
5 devices at the same time
Second-based intervals
Alerts that don't expire
4x more data on charts (20K bars)
Publishing invite-only indicators
Question no 2:
Explain the different features of tradingView and what is your favorite feature and why? (screenshot necessary)
The different features of the trade view are;
- CHART
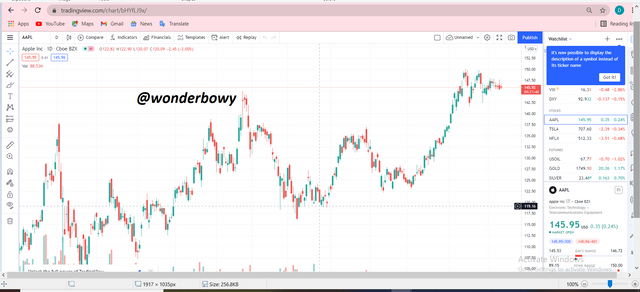
One major feature of the trading view is the chart which happens to be where most of the investors or traders do their fundamental and technical analysis before performing any sort of investment. The chart consist of watch list, calendar, price of various assets, candle sticks etc. The user can set the chart to his or her preference in terms of appearance and style.
- TRADE
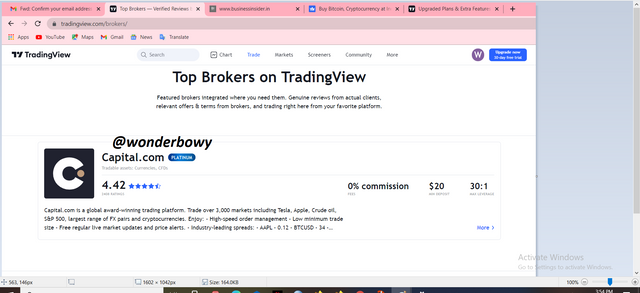
This feature of the trading view is meanly to recognize some top traders on the platform and also give awards to them. Some top broker is Capital.com .
- MARKETS
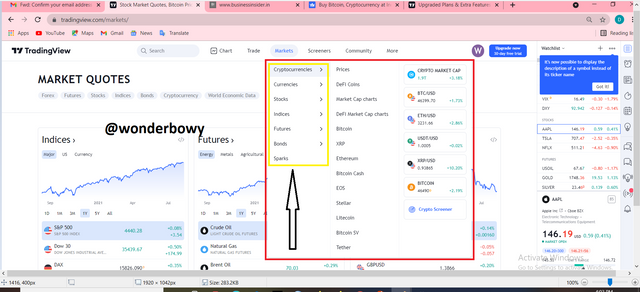
This is also one major feature of the trading view which consist of cryptocurrencies, currencies, stocks, indices, future, bonds, etc. It has many type of trading and for that matter every trader with his or her choice of trade.
- COMMUNITY
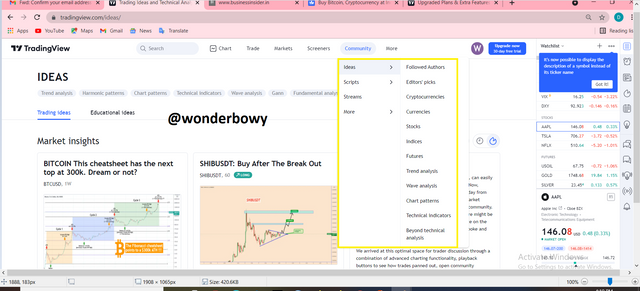
This is more like the social media platform of trading view. It consist of people from diverse places who wants to share common ideas, technical thoughts etc.
- SCREENERS
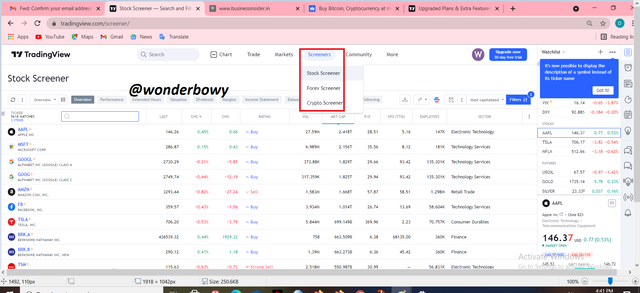
This is also another feature of the trading view which consists of forex screener, stock screener, and the crypto screener. This feature of the trading view is normally used to screen assets that they think is best for traders to trade on.
MY FAVORITE FEATURE OF TRADING VIEW;
When it comes to trading, one thing that a trader cant do without is the chart. This is very essential because the trader is able to determine whether the asset has dipped or pumped. In this manner, you can either make decision on whether to sell or buy because of the position of the chart. This is why the chart is considered as the technical and fundamental aspect of any trading platform. I for that matter loves to use the chart more often and that is one reason why i will prefer it to any other feature of the trading view.
Question no 3:
How to set up a chart in TradingView and use two tools to edit it.(screenshot necessary)
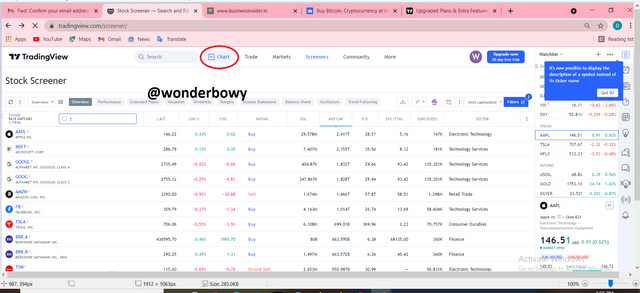
First of all we click on chart as seen in the above screenshot. It will open in the default mode. Remember trading view gives every trader the chance to set up their chart to their preference and taste. Meaning you can change the style of your chart to look just how you think will feel comfortable with. Not every trader likes these appearance of some colors, they might say its to bright, its too deem etc. Most at times too some may have eye problems therefore not every color will be comfortable for the eye especially very bright colors. Trading view is giving you the chance to manipulate all these to your likeness.
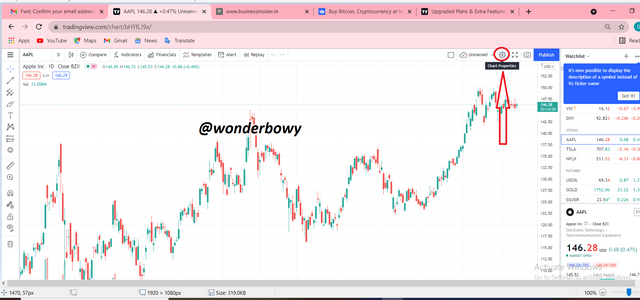
Click on CHART PROPERTIES as seen in the screenshot above.
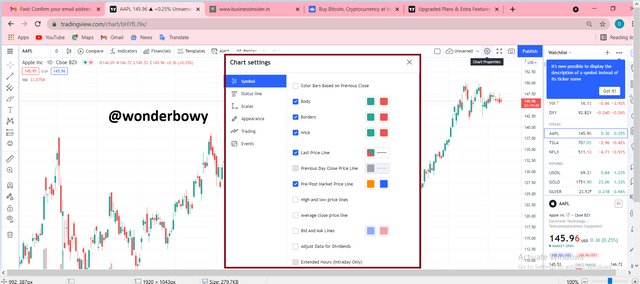
The above is what will pulp up after clicking on CHART SETTINGS/PROPERTIES.. The basic features of Chart Settings are listed and elaborated on below;
SYMBOLS;
it helps the trader to set the colors of his or her candle sticks to his or her likeness. This is done by clicking the color beside them. You can change the color of the body, border, wick etc to suit your taste.
STATUS LINE;
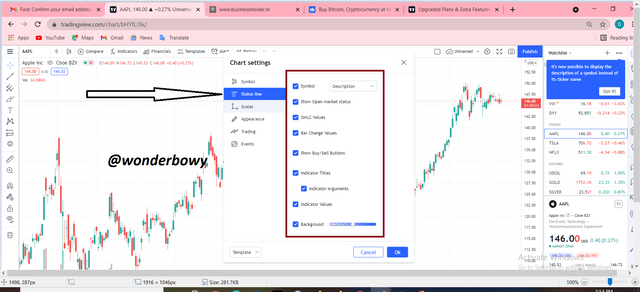
Also very important feature with some components like Show Open Market Status, OHLC Values, Bar Change Values, Show Buy Or Sell Buttons, Indicators Titles,Indicator Values and Background enables you to change a lot in terms of the appearance of your chart. It can be done by selecting and un-selecting them that will depend on whether you want to see or not to see them on the chart.
SCALES;
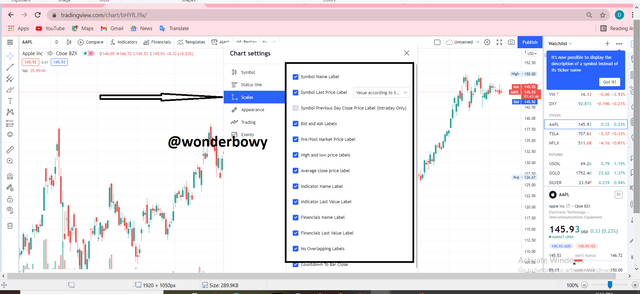
with this feature, yo will be able to un-select or select some items to suit your taste as a trader. Some of this feartures are currency, No Overlapping Labels, Bid And Ask Labels etc.
APPEARANCE
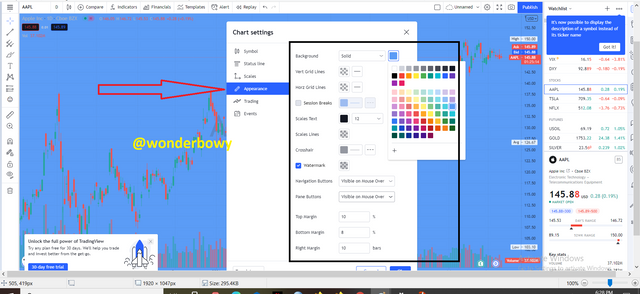
As you cab see in the screenshot above, this option enables the chart to be changed in so many ways especially how it works. You can change the whole background with the color of your choice. so many colours to choose from when it comes to background colour settings. You can also add water maker to your chart, scale your text to a sizable one, change the percentage of the various margins etc.
TRADING
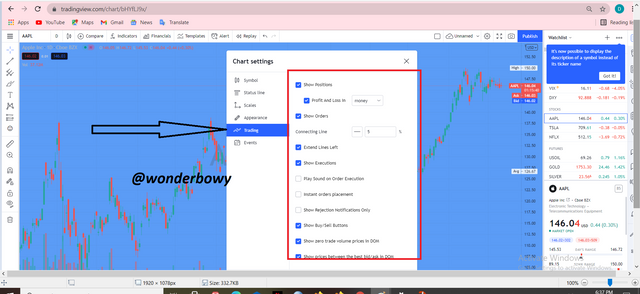
This part of the trading view features comes with components such as show position, show buy and sell order, profit and loss etc.
EVENTS
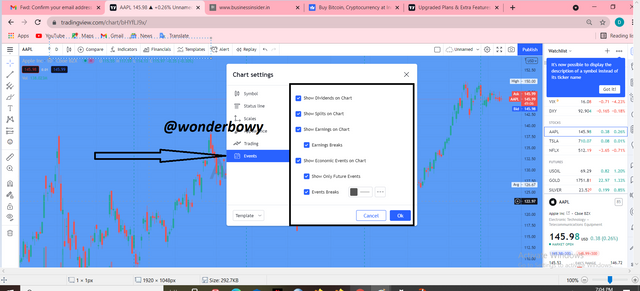
The event contains some features like Show Only Future Events On Chart, Show Splits On Chart, Show Dividends On Charts etc.
Question no 4:
Adding indicators to the chart can be done by simply clicking on the fx Indicator as seen in the screenshot below.
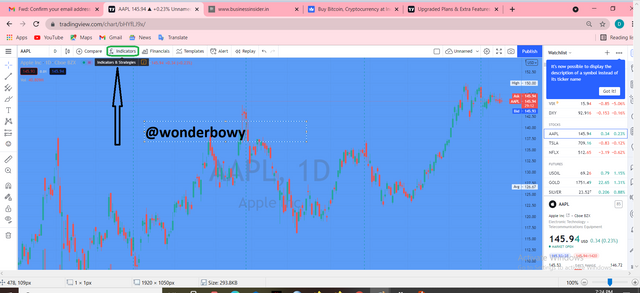
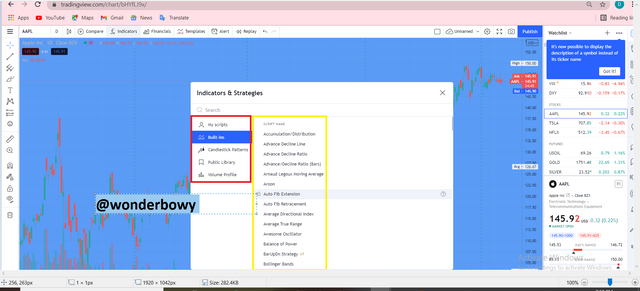
You can search for the indicator of your choice by typing the name in the search box as seen in the screenshot above.
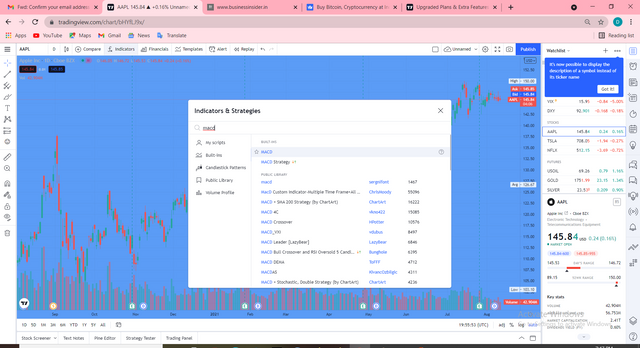
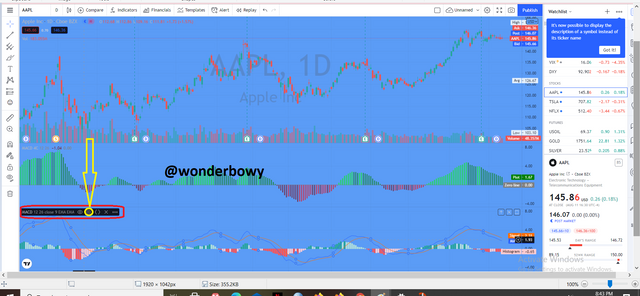
I often use MACD indicator so I just type it in the search box and there it is. I then click on it to add to chart.
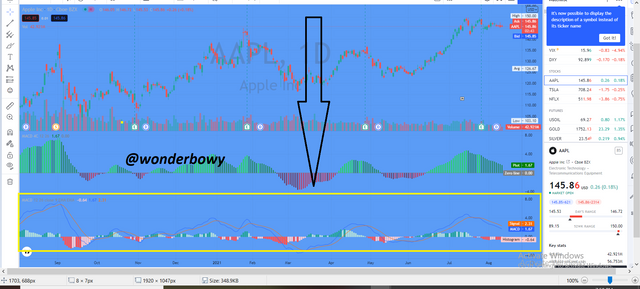
MACD Indicator added successfully to chart as seen in the screenshot above...
####### Explain how to add indicator in chart, what is your your favorite indicator and why? (screenshot necessary)
Now lets take a look at how i add my favorite indicator which happens to be MACD INDICATOR.
So from the above I demonstrated how any indicator can be added but this time round lets take a look at how a particular indicator can be added to a chart "MACD"
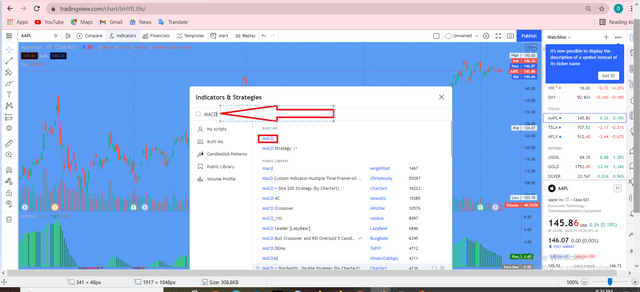
CLICK ON THE SEARCH BOX AND TYPE MACD, FROM THE DROP DOWN MENU CHOOSE MACD...
NOW MACD INDICATOR ADDED SUCCESSFULLY... THE GOOD NEWS IS I CAN EDIT THIS INDICATOR TO MY TASTE AND PREFERENCE, LET ME SHOW YOU BELOW.
CLICK ON THE MACD INDICATOR AND SHOW THIS EDITTING FEATURES WHICH INCLUDES SETTINGS,
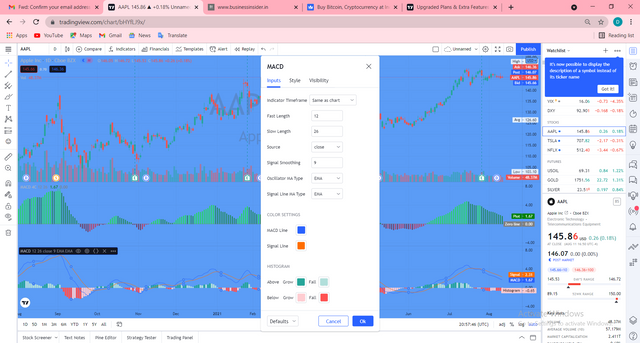
WHEN YOU CLICK ON THE SETTINGS BUTTON THIS IS WHAT SHOWS UP, THREE VERY IMPORTANT FEATURES WHICH ARE INPUTS, STYLE AND VISIBILITY.
INPUTS
Some of the features to help edit your MACD shown above in the screenshots.
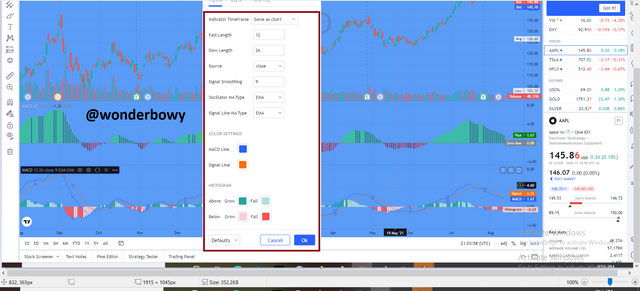
STYLE
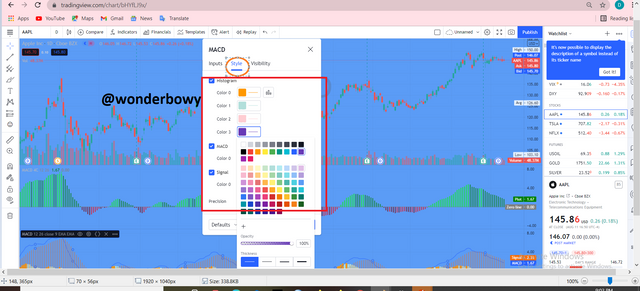
The Style section is meanly how the MACD looks like in terms of colour, so i changed the colour of the histogram, The MACD LINE itself and also the SIGNAL LINE.
VISIBILITY
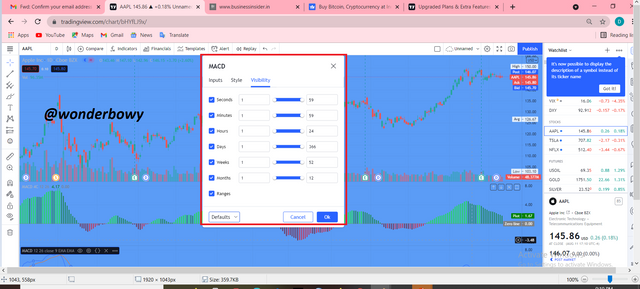
This settings is also another feature that allows a trader to change the appearance of the chart to suit their taste.
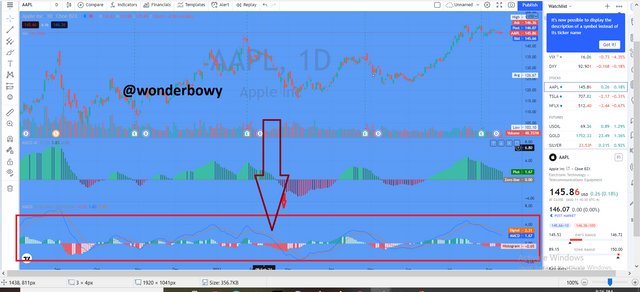
WHY I LIKE THE MACD INDICATOR
I really like the MACD because of its a quick ability to tell the price of any pair of assets an investor is trading. The MACD is able to tell when the price of an asset will fall or increase. Its cuts the signal line from either above or below. When it cuts it from above downwards there is a signal of a decrease in price signing to the trader to sell and when the MACD cuts the signal line below upwards its a sign of a possible increase in price of the asset signing a buy. Just that there could be a falls signal. That is why the investor needs to be extra alert as well. But all the same its my favorite indicator compared to the others.
Question no 5:
Do you think TradingView is useful in predicting the market for cryptocurrency (trend / price)?
My answer is straight forward YES!!!!!!!!!. I think trading view is a very unique platform with lots of great features to play around with. You have the chance to change certain features to suit your taste as a trader for easy usage. Making more profit is certain as a trader with this platform. Its social media platform with great traders gives you the chance to learn from some experienced traders around the world. With all this tools at your disposal as trader will definitely make your work very easy for you. You have an upper hand in profit making than making losses. One major feature i like using is the MACD INDICATOR its such an amazing feature for maximizing profit as a trader. You you have not tried it, i advice you do. I have spoken about it in the above question.
Conclusion
A very big thank you to steemit blog and cryptoacademy for this weeks section of great lectures. Not forgetting our noble prof @yousafharoonkhan for taking us through such an amazing class. I really enjoyed your class and taking part in your task. Hoping to attend your next lectures and take part in your task once again.
Thank you.
Respected first thank you very much for taking interest in SteemitCryptoAcademy
Season 3 | intermediate course class week 7
thank you very much for taking interest in this class
Thanks for the good feedback, I really appreciate it and hoping to take part in your next class.