Candlestick patterns | Steemit Crypto Academy Season 4 | Homework Post for profesor @reminiscence01 Task 10
 )
)
Greetings crypto community, it have always been a pleasure to be part of this community. I will be performing this task 10 about candlestick patterns, in confirmation of my understanding of the teaching.

Introduction
Cryptocurrency trading is the widest part of cryptocurrency which are digital currencies deviced for exchanges and without proper knowledge of what cryptocurrency is all about, you are taking a huge risk, investing in it.
For crypto trading to be worth it, you should get aquianted with basics of technical analysis which may involve understanding trading psychology and the candlestick patterns.
Homework
1a) Explain in your own words, the japanese candlestick chart (original screenshot required)
b) Explain in your own words why the japanese candlestick chart is the most used in the financial market
c) Describe a bullish and a bearish candle. Also explain its anatomy (original screenshot required).
Question 1a
Explain in your own words, the japanese candlestick chart (original screenshot required)
.png)
In the 1700s a japanese rice trader by name Munehisa Homma, who was seeking for ways to understand the relationship between demand and supply in the market and the market psychology at a given point in time came to the the conclusion that brought about the emergence of the Japanese candlestick.
Japanese candlestick have grown so much to the point that it is now highly recognised in the forex market, crypto market stock market, etc.
Candle stick can either have a green/white colour representing a bullish run, or a red/black to represent a bearish rally, which clearly entails the force of demand and supply at that point.
The law of demand and supply states that everything being equal, the higher the demand the lower the supply and the higher the supply, the lower the demand. i.e when there are more demand for a commodity than the supply, there is an increase in price hence the bulls are in control of the market while when supply is more than demand there is a decrease in price hence the bears are in control of the market.
The totality of these changes/moves are been inculcated in the Japanese candlestick chart over different time zones ranging from 1minute to a year.
The japanese candleatick pattern which is derived from the chart helps traders make the best trading decision.
(b)
Explain in your own words why the japanese candlestick chart is the most used in the financial market.
The japanese candlestick pattern is one of the best if not the best candlestick pattern in The world of trading because of its ability to convey accurate graphics of price change over time.
Some of the many reasons are;
Market movement : japanese candlestick chart embodies different shapes and colours of candle with which you can predict the direction of the market at the moment.
Easy understanding of market patterns : patterns like doji candlestick, hamari etc that are detectable only in japanese candlestick but not in others trading patterns help traders in understanding what the market looks like.
Dictation of price action: with the colour and shapes of the candlesticks you can detect the price action faster.
(C)
Describe the bullish and the bearish candle also, explain its anatomy. (Original screenshot required)
.jpeg)
In the financial market, the most functional interactive medium is the candlesticks. The bearish candlestick shows a down trade while a bullish candlestick shows an uptrend.
from binance
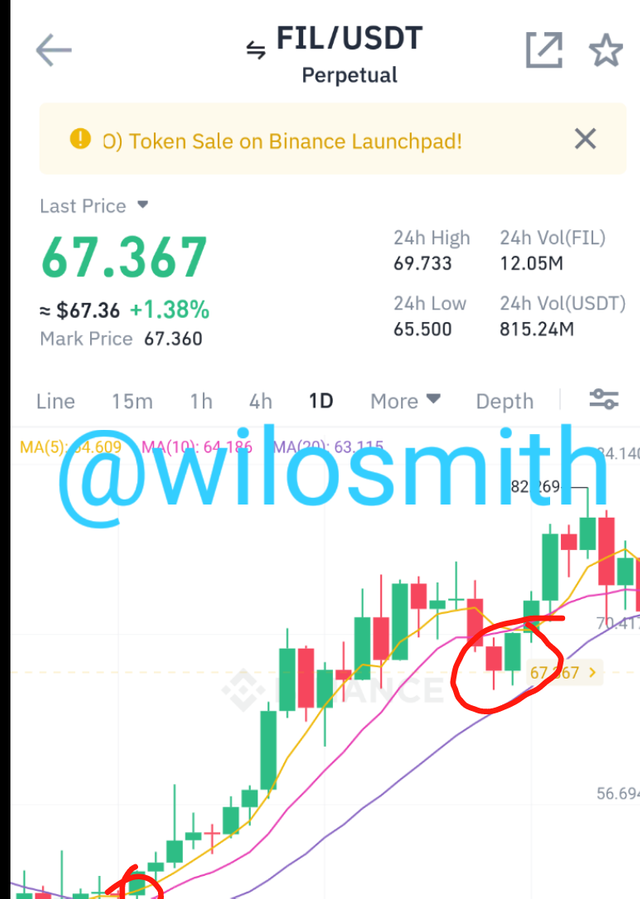
In a bullish candlestick, the price opens lower and closes higher. Bullish candles closes above the previous candle indicating increase in demand above supply, showing that bulls/buyers are in control of the market.
Anatomy of A bullish candle.
Every candle has 4 parts viz;
Open: this is the commencement of a candle also called the opening price of a candle in a bullish candle it opens lower indicating change in price movement.
Low: this talks about the lowest level that can be reached at a given trading period. Sometimes the low is below the open which indicates struggle between bulls and bears at that point which was finally won by the bulls.
Close: this indicates the closing point of a candlestick. It is also referred to as the closing price. The closing of a bullish candle is always above the open and the low.
High: the highest point reached in i given trade period is the "high". In a bullish candle the high is always either above the close or at the same point with the close. When it closes above the
Close it signifies an increased buying pressure that drove it above the close and then selling pressure retraced it.
Bearish Candle
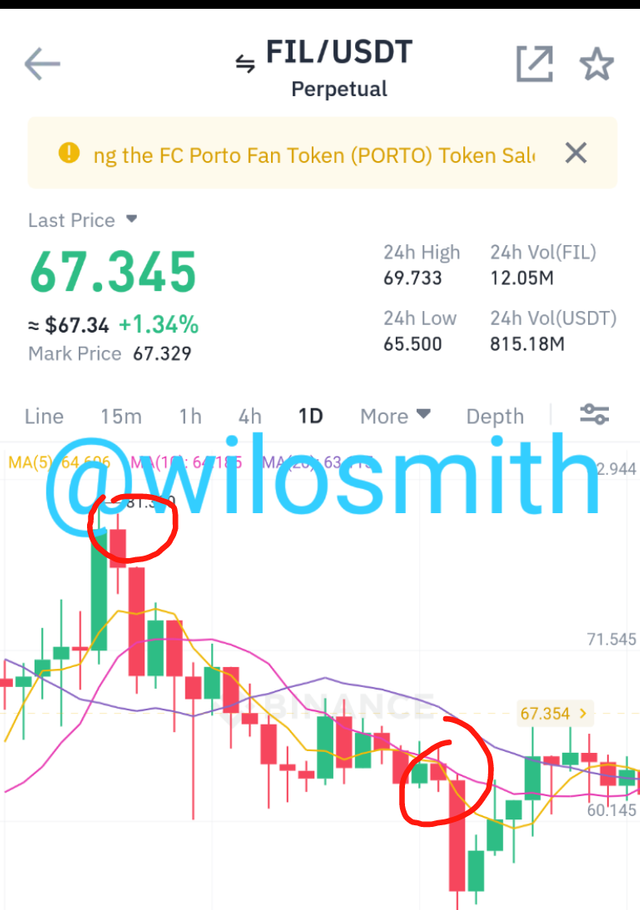
From binance
A bearish candle simply opens high and closes low after the given time. Bearish candle unlike bullish candle closes lower than the previous candle, indicating bullish dominance.
Anatomy of a Bearish Candle
Bearish candle like the bullish candle has 4 parts which are ; high, low, open and close.
Open: open talks about the beginning of a price movement. In a bearish candle, it opens higher.
High: this is the highest attainable level over a period of trading. Sometimes it is at the level of open but when the buying pressure is high it drive the price above the open and then the selling pressure bring about the downtrend/retracement.
Close: this is the point of obstruction in the candle. It is also known to be the closing price. A bearish candle closes lower that it opens.
Low: the lowest lowest priced reached during a trading period is the low. It can close at the same price as the close or below the close depending on market force.
CONCLUSION
With joy in my heart i will like to give it out to porf. @reminiscence01 for the teaching. And to my readers I say thank you.
Do not use the #club5050 tag unless you have made power-ups in the last month that are equal or greater than any amount you have cashed out.