Steemit Crypto Academy Season 5 Week 1 [Beginner's Course] - Understanding Trends: @whyshy
INTRODUCTION
Hello Steemians,
We are in the first week of the 5th season of Steemit Crypto Academy. Thanks to @reminiscence01 for his course on this topic 'understanding trends'. You can see my assignment below.
Today, crypto investors have started to increase. Naturally, the market volume increased. To be a conscious investor, it is necessary to take conscious steps. That's why in this homework we're going to learn all about trend. I will strengthen the investments I will make with this information we have learned, thanks to solid trend lines.
1) a) What do you understand by a Trending market?
I liken the crypto market to the sea. The reason for this is the constant mobility caused by the increase and decrease in demand. This is why a trending or changing phase is seen in the crypto market.
If the number of sellers in the market is higher than the number of buyers, we see a downward trend. On the contrary, if the number of buyers is higher than the number of sellers, we see an upward trend. This actually applies to everything. When there is a large supply, that product decreases and its cost increases.
So how does the market move when it's trending? Uptrend and downtrend are observed. We can say that the movement made in a certain direction in a certain period of time is a trend. We can consider it as a horizontal trend if the price is limited between the consistent support and resistance points.
Knowing the trend well is important to avoid situations such as upside profit or loss during the decline.

b) What is a bullish and a bearish trend? (screenshot required)
There is a Bullish trend and a Bearish trend in the financial market. These names are taken from the actions of these animals during the attack. So what is a bull trend and a bear trend?
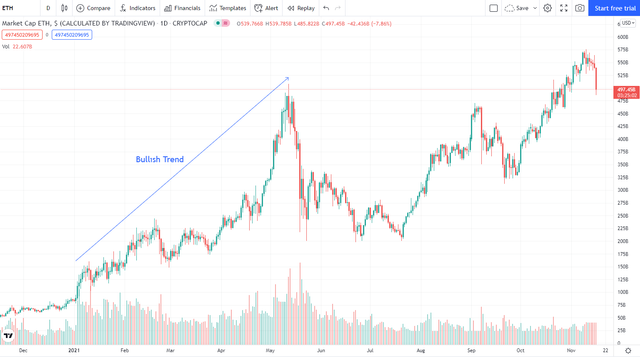
A bullish trend is a sequential and continuous increase in the relevant commodity in the market. In this case, bulls usually control the market. The supply is constantly increasing, and with the increase in supply, the rise is continuous. Even if the price is at its peak, those who think that it will rise even more, contribute to this rise by purchasing from here.
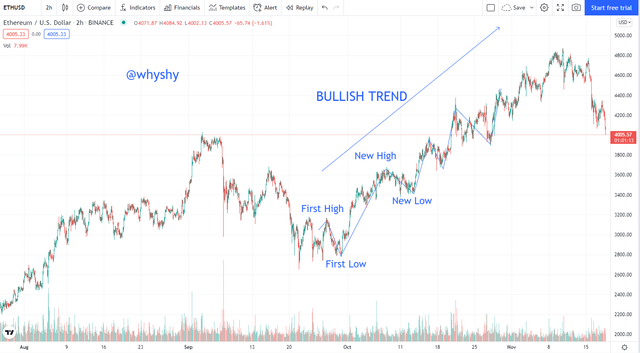
Example bullish trend.
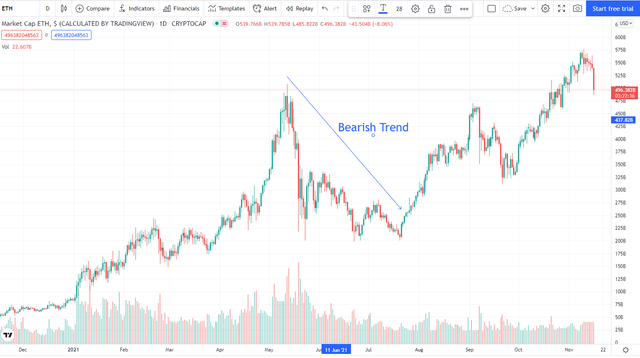
A bearish trend is when the commodity experiences consecutive declines. This time causes commodity owners to become pessimistic and take big risks and make losses.
2) Explain the following trend identification and give an example of each of them. (Original screenshot needed from your chart). Do this for a bullish and a bearish trend.
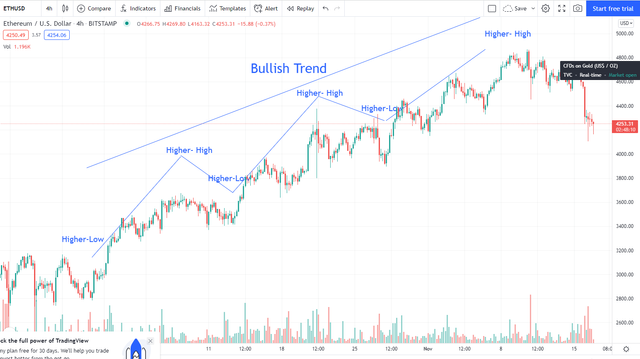
i) Market Structure.
It gives us general information about the state of the market. We can see how the movement in the market changes on the graph.
The chart shows a bullish trend. Here we see the Higher-high and higher-low movements. In this way, the trend is always up. Even if it is low, it does not go down to the previous low. Likewise, the high closes above the previous high.It gives the opportunity to sell with the rises. It gives the opportunity to buy with lows.
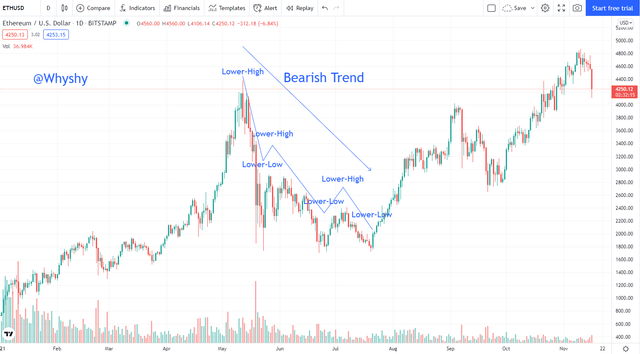
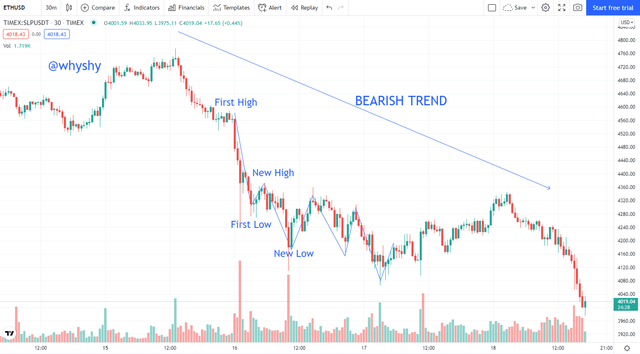
When the market is followed for the bear trend, a lower-high and a lower-low pattern is seen. The market is constantly falling.
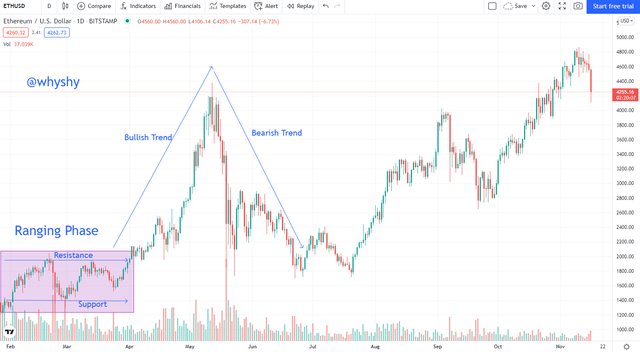
Horizontal movement can be observed in the market, except for the rise and fall situations. It moves between support and resistance points in a changing market. These situations occur frequently before ascension.
ii) Trendlines
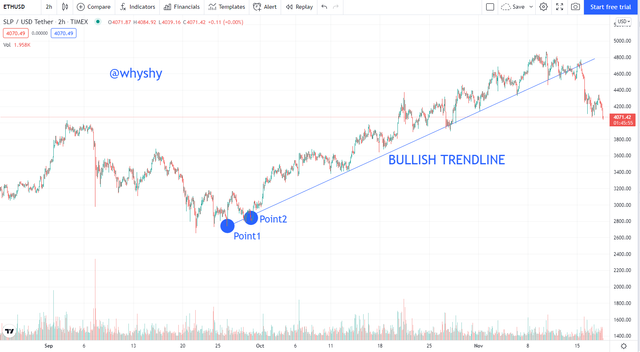
We use the trend line frequently in our technical analysis. Thanks to the trend lines, we can see the upward and downward movements in the market in advance. For the uptrend, the line where it moves is checked by combining the 2 low points with each other.
After the uptrend line is drawn. A commodity price touching the trendline encounters support. If it fails to break the support, the upside continues. If this support is broken, the downside starts. You can start to enter a downtrend.
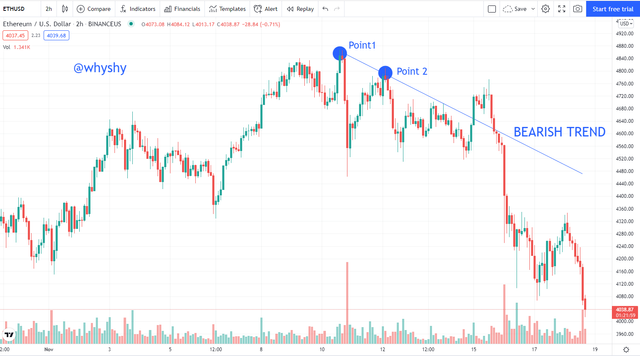
In a downtrend, it is the opposite of an uptrend. If the commodity sees a resistance on the trend line drawn in its upward movement and cannot break this resistance, the downward movement continues. If the resistance is broken, an uptrend can be entered.
3) Explain trend continuation and how to spot them using market structure and trendlines. (Screenshot needed). Do this for both bullish and bearish trends.
Here I want to give the same example again. There is continuous buying and selling in the market, just like the movement of waves in the sea. This buying and selling creates certain fluctuations. In this way, we create a trend line.
Bullish trend:
1- The visible upward peak must be higher than the previous peak.
2- The downward peak seen should be higher than the previous one.
Bearish trend:
1- The visible upward peak should be lower than the previous peak
2- The downward peak seen should be lower than the previous one
In these trends, resistance points and support points are always wanted to be tested. When the support or resistance points are broken, an opposite movement may occur.
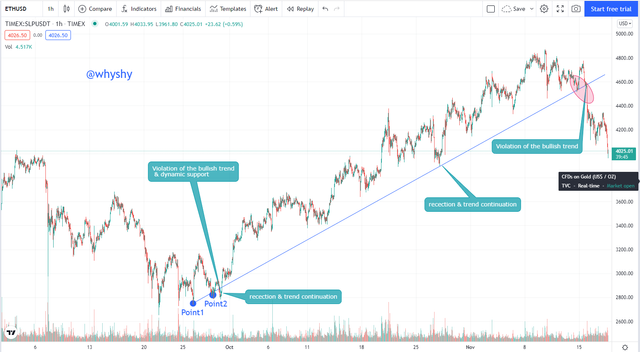
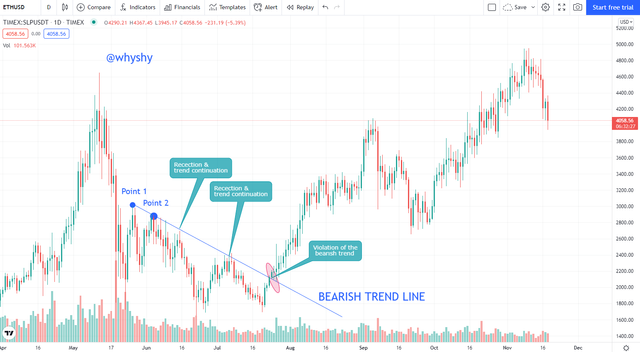
Speaking again, trend lines will be our reference. The direction may reverse when the trend line is broken in up and down trends. It is important to take a position accordingly. I have detailed it in the chart below.
4) Pick up any crypto-asset chart and answer the following questions.
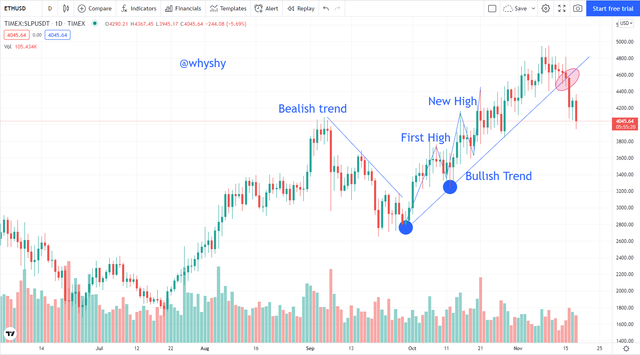
i) Is the market trending?
I chose the ETHUSD crypto pair. I marked the daily candlestick chart. In October, an uptrend trend was realized. However, in mid-November, the support on the trend line was broken and the downtrend trend was realized. As of today, the downtrend trend continues. So there is a downward trend in the market.
ii) What is the current market trend? (Use the chart to back up your answers).
The current trend is bearish.
As I mentioned briefly above, now you need to be careful. Support points should be followed well. Each support broken will increase the downtrends. Of course, at this stage it is better not to make a decision only by trend analysis. Different technical analysis should also be used.
5) Conclusion.
Understanding trends is actually like playing chess in the market. Thanks to these trend lines, we can think about the next step to come. These trend lines also somewhat prevent small investors from becoming whale food. Trendlines are always tested. There is no unbroken trend line. A commodity does not always rise and does not always fall. It is constantly in waves. There were many topics that we learned with the course and reinforced with this assignment. We can tell when the market is in an uptrend, downtrend and change phase.
Cc:
@reminiscence01
I think it is a very useful homework for me and for you. None of my charts and comments are investment advice. This is just a useful assignment. I also took all the screenshots from www.tradingview.com. I answered all the questions asked in the homework. Thank you in advance for the review.
Stay healthy. Goodbye.
Hello @whyshy , I’m glad you participated in the 1st week Season 5 of the Beginner’s class at the Steemit Crypto Academy. Your grades in this task are as follows:
Observations:
Your chart is correct for a bullish market structure. But your mark up will be difficult for your readers to understand. You can see how this was drawn in the examples given in the lesson.
Recommendation / Feedback:
Thank you for participating in this homework task.
Hello professor,
I actually drew it that way on purpose. I made the uptrends for them to see more easily outside the chart. I drew it as it should be in the graphics below.
I also got 1 point for using markdown. I did my best to get full marks for it.
Again, thanks for your advice and review. 👍 😊
Hello professor @reminiscence01 . When is the voting? Do you have information ?
Hello sir,
My homework has been successfully completed and scored. But my assignment was not voted on.
cc : @steemcurator01
#club100
Hello sir,
My homework has been successfully completed and scored. But my assignment was not voted on.
cc : @steemcurator01
@sapwood
#club100
@reminiscence01
Why is homework not taken into account? Many people complain about it. If your votes are not guaranteed, make it clear in the crypto assignments announcement. People spend hours on these assignments. that steemit is not a purely crypto-dependent platform. Please, I ask you to pay attention to the votes.
Thanks .
cc ; @steemcurator01 @steemcurator02
As a result of this situation, I did not do the homework in the 2nd week of the 5th season. Because this uncertainty and negligence demoralized me. I hope our efforts can pay off.
cc ; @steemcurator01 @steemcurator02