Estrategia y uso de los Canales de Donchian - Crypto Academy/S5W1 - Homework post for @lenonmc21 - by @whyshy
INTRODUCTION
We are in the first week of the 5th season of Steemit Crypto Academy. Frankly, this 5th season is very beneficial for the investments I will make it will be.In this assignment, I will share with you what I learned about the Strategy and use of Donchian Channels.
We should not randomize our investments and focus on a single analysis. We should take a position accordingly by analyzing with multiple analysis programs.
Thanks to @lenonmc21 for his course on this topic 'Estrategia y uso de los Canales de Donchian'. You can see my assignment below.

Teoría
1.¿Explique y defina con sus propias palabras qué son los Canales de Donchian.?
We should know that we do not easily earn what we earn while making our investments. That is why we should not act easily and quickly. It will always be beneficial to be patient and move forward by doing our technical analysis.
In this assignment, we will analyze with the help of the donchian channel. The name of the person who started this process in the 1930s is "Richard Donchian". They started to keep 20-day averages while trading on American stock markets. They have brought a rule with these averages. In these rules, they sell when they reach the bottom of the channel. They buy when they reach the top of the channel. Today, we can easily see candles. This makes our job easier.
Now let's learn how to activate and use this Donchian channel on tradingview.
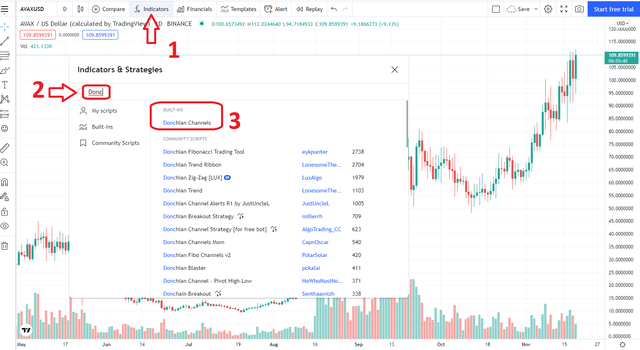
First of all, we enter the place where I marked Fx Indicators with (1). When we type (2) Dochian in the search section in the opened tab, Donchian Channels (3) will appear and we will log in.
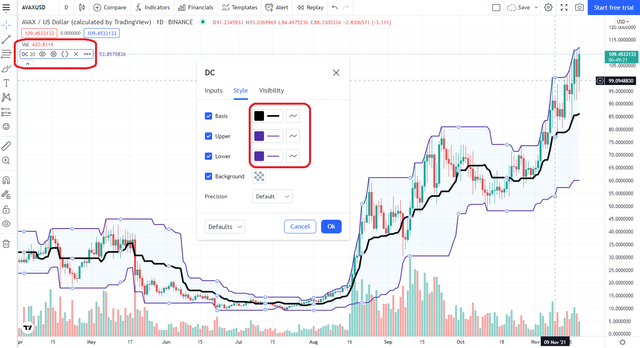
On the left, we can close this channel whenever we want. Also, double-clicking on the channel opens the DC tab. From here, we can adjust the channel line color and thickness. I made the line in the middle band black and thick for clarity here. I set the lower and upper bands to dark blue.
2.¿Explica con detalle cómo se calculan los Canales de Donchian (sin copiar y pegar de internet)?
The calculation of the Donchian Channel is made by taking the 20-day average as I mentioned at the beginning. There are 3 bands in front of us. The center of these bands is the Midrange band. It is found by averaging the highest and lowest bands. So the previous candles should be taken as the basis for the formation of this channel.
In the high band selection, the highest value of the selected time interval is taken.
In low band selection, the lowest value of the selected time interval is taken.
The midrange band is obtained by adding the highest value with the lowest value and dividing it by two.
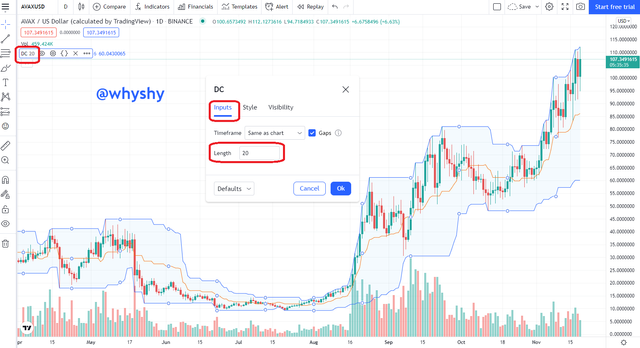
There is a length setting in the indicator settings. the default setting is 20. This channel is created by taking the Highest and Lowest values of 20 candles. Here the length can be changed. We can also change the time intervals in the graphic.
3.¿Explique los diferentes tipos de usos e interpretaciones de los Canales de Donchian (Con ejemplos de operaciones alcistas y bajistas)?
There are Overbought and Oversold zones in Donchian channels. These regions occur in the upper band and the lower band. Different selling occurs in the upper or lower band approaches of the candles. In addition, volatility interpretation is made.
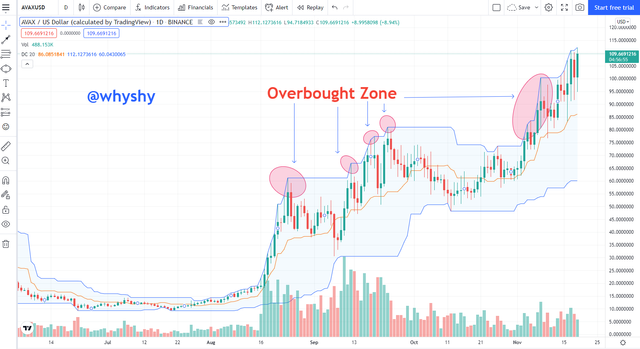
Overbought Zone
If the candles formed in this region approach or cross the upper band, the uptrend starts here. Overbought happens. However, there may be decreases with these purchases. However, it wants to push the upper band more and tries to move the trend upwards.
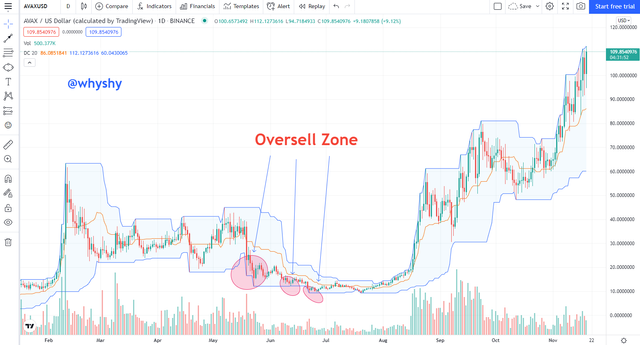
Oversell Zone
It is the opposite of Overbought. A downtrend is formed as the candles approach the lower band and force the lower band. This formation creates an oversold zone. There may be a rise with this sale. But it pushes the lower band more and turns the trend down.
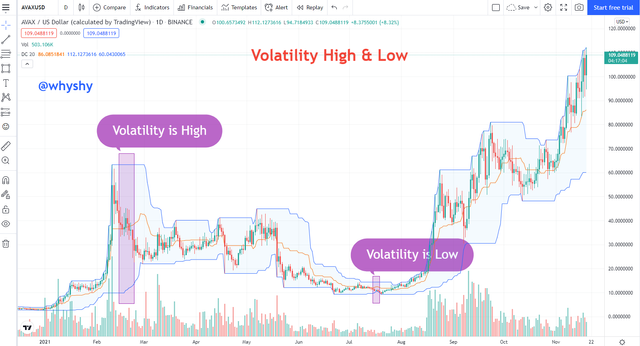
Volatility Review
Since it occurs in the highest and lowest band gaps in the Donchian channel, the most precise and clear information it can give us is the volatility information.
The greater the volatility in the market, the greater the volatility and the larger the bandwidth. In this case, price stability is not known exactly. In the other case, the volatility will be low in the waveless market. Therefore, the bandwidth becomes smaller. In this case, the price moves steadily.
Practica
4.Realiza 1 entrada utilizando la "Estrategia de Ruptura de los Canales de Donchian" y realiza 1 entrada utilizando la "Estrategia de Reversión y Retroceso" . Debes explicar el paso a paso de como analizaste para tomar tu entrada y hacerlas en una cuenta demo para yo evaluar como fue tomada la operation.
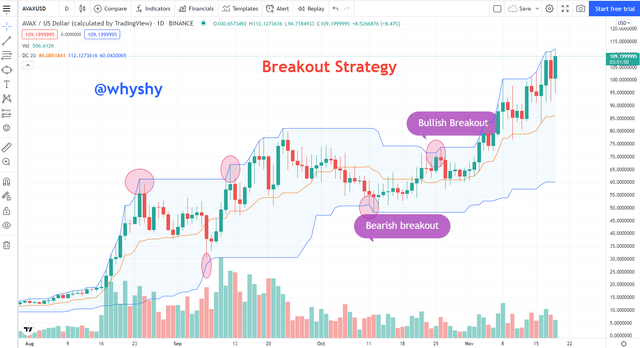
Donchian Channel Breakout Strategy
An uptrend can occur when the ascending candlestick approaches or touches the upper band. But even if there is a decrease, it will be desirable to try new highs again. Stop-loss can be placed at the upper band and lower band borders within the channel.
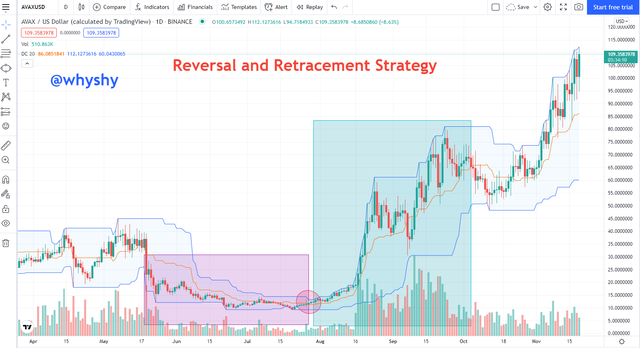
Reversal and Retracement Strategy
While the candles are in an uptrend, the price range fluctuates between the upper band and the mid range band. This trend becomes a bullish trend. In a bear trend, candles fluctuate between the lower band and the mid-range band. If the mid-range band is broken in either trend, the direction may reverse.
To summarize;
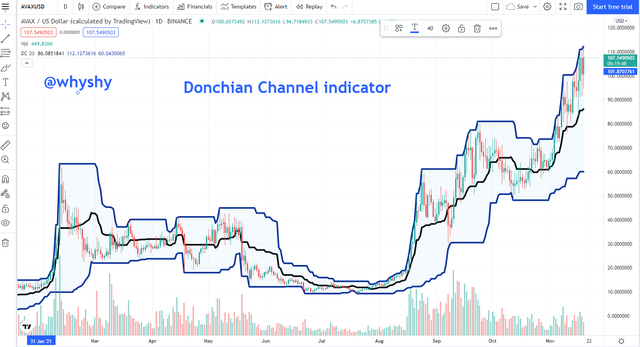
We are logging into the demo account. We choose the crypto we want to analyze. I chose AVAX/USD. We add the Donchian channel from the Fx Indicators section. We can apply a breakout strategy for a guaranteed and no loss gain. The purchase is made when it touches the lowest peak seen, that is, the lower band. When it touches the upper band, the sale is made. This does not mean that the trend will decrease. It can be acted on by examining the current trend direction. The most suitable position for buying is the lower band, which is also the lowest peak.
Conclusion.
With the course I took and this assignment I did, I learned how to do technical analysis with Donchian channels. These analyzes, which I learned in the crypto academy, have an important place in my analysis of my investments. Thanks to these assignments, I can predict the next candles that may occur and the belt height that may occur.
Cc:
@lenonmc21
I think it is a very useful homework for me and for you. None of my charts and comments are investment advice. This is just a useful assignment. I also took all the screenshots from www.tradingview.com. I answered all the questions asked in the homework. Thank you in advance for the review.
Hello sir,
My homework has been successfully completed and scored. But my assignment was not voted on.
cc : @steemcurator01
#club100
Hello sir,
My homework has been successfully completed and scored. But my assignment was not voted on.
cc : @steemcurator01
@sapwood
#club100
My homework score is 5. But when I should have been rated 7.5 percent, I was rated 5.
Can you make the necessary edit?
cc:
@steemcurator01
@steemcurator02
@sapwood