On-chain Metrics(Part-2)- Steemit Crypto Academy- S4W3- Homework Post for @sapwood

Introduction
Hello friends and welcome to my assignment task by professor @sapwood, where I talk about Onchain Metrics part 2, I hope you enjoy my assignment 😊😊.

Question 1
What is the difference between Realized Cap & Market Cap, How do you calculate Realized Cap in UTXO accounting structures? Explain with examples?
Realized Cap
The Realized Capitalization is a type of Market Capitalization, it operates by identifying the Price of a UTXO had since it was last moved and uses that price to re-evaluate its Realized cap based on the current value of the crypto asset.
For every transaction made there is an Unspent Transaction Output and this UTXO can be left in that address for several years, but its value will be based on the last price it had since it was last transacted. If the UTXO is then spent at a higher price than what it had during its last transaction, then it will contribute to an increase to the realized market cap, but when the UTXO is spent at a price lower than it had since it was last moved then it will have a decreased impact on the realized market cap. Also if the UTXO is spent at the same price as it had since it was last spent then it would not have any impact on the realized capitalization.
Market Cap
Market Capitalization is the overall valuation of a crypto asset based on the dollar, it is calculated by multiplying the current price of a single unit of a crypto asset with the overall number of the crypto asset in supply.
For example, if the current value of coin x is $3 and it has a supply of 21 million x.
Therefore to calculate the Market Capitalization = 21 million x *$3 = $63 million.
Therefore the Market Cap of coin x =$63 million.
The difference between the Market Cap and the Realized Cap
- The Realized Cap is calculated based on the UTXO price since it was last moved while the Market Cap is calculated based on its current price.
- The increase and decrease in the Realized cap can be of effect only if the current price is higher or lower than the Price it had since it was last moved, While the increase of Decrease in the Market Cap is base on the increase or decrease in the price of a single unit of the crypto asset.
How to calculate Realized Cap in UTXO accounting structures
To get the overall Realized cap of an asset re-evaluates the price based on the UTXO price since it was last moved.
it is calculated using this formula below:-
Realized Cap=value⋅price created [USD] (of all UTXOs)
source
Let's take for example 100 species of BITcoin were left in a wallet. 50 Bitcoin has not moved from that address since 2013 with the value at then being $100, also 30 Bitcoin has not been moved since 2015 with its price at then being $250 another 20 Bitcoin has not been moved since 2017 with its price at then being $1000.
To calculate the Realized Cap = (50 x 100)+(30 x 250)+(20 x 1000) = $32,500
Question 2
Consider the on-chain metrics-- Realized Cap, Market Cap, MVRV Ratio, etc, from any reliable source(Santiment, Glassnode, etc), and create a fundamental analysis model for any UTXO based crypto, e.g. BTC, LTC [create a model for both short-term(up to 3 months) & long-term(more than a year) & compare] and determine the price trend/predict the market (or correlate the data with the price trend)w.r.t. the on-chain metrics? Examples/Analysis/Screenshot?
Realized Cap
The realized capitalization is a type of market valuation that re-evaluates the capitalization of an asset based on the price of the UTXO since it was moved.
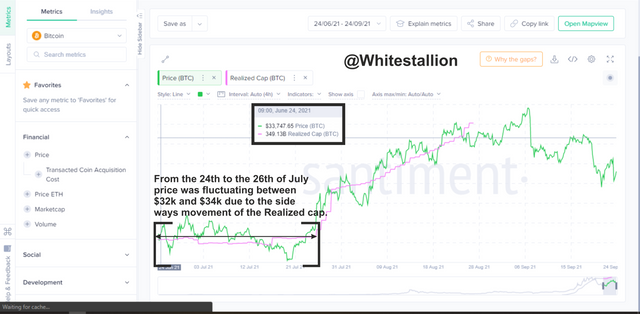
The Realized Cap is also an On-chain metrics indicator that predicts the price movement of an asset by moving in an upward or sideways trend. Below is a 3 month and 2-year chat that indicates the direction of the market.
- Realized Cap under 3 months
source
Starting From the 24th to the 26th of July, the price was fluctuating between $32k and $34k due to the sideways movement of the Realized cap which indicates a Bearish or Sideways movement for the Price of the asset.
- Realized Cap under 2 years
Under 2 years, the Realized Cap indicator tends to move in the corresponding direction with the price, but with a sideways movement of the Realized cap, there was a huge retracement in the Price of BTC.
Market Cap
Market Capitalization is the overall valuation of an asset-based on the dollar, it is calculated by multiplying the price of a single unit of that asset with the total supply of that asset. It is also an On-chain metrics indicator used to monitor the valuation of an asset.
- Market Cap under 3 months
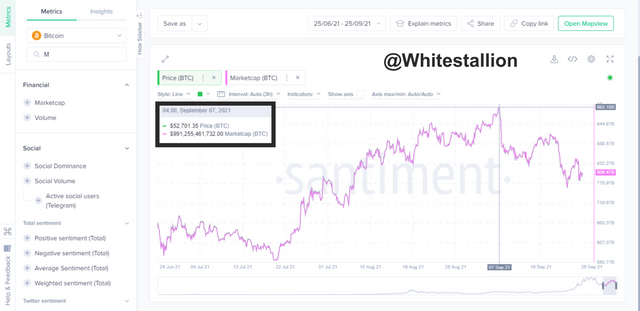
The Market cap under 3 months shows that the increase in the price of the asset corresponds with the increase in valuation of the Market Cap, also a price decrease will correspond with a decrease in the valuation of the market cap. From the Image above, the price of BTC rose to around $52k this caused the Market Cap to increase to around $991 Billion, also when the price fell to $47k there was a corresponding decrease of the Market Cap to $884 billion.
- Market Cap under 2 years

source
Under the 2-year time-lapse, the correlation between the Price and Market Cap of BTC is evident. The price of BTC which peaked at $64k saw a corresponding increase of the Market Cap to $1.207 Trillion, also on the 20th July 2021 the price of BTC saw a decrease in Price around to $29k this caused a corresponding decrease to the Market Cap which fell to $559 Billion.
MVRV Ratio
The MVRV Ratio or Market-value-to-Realized-value is an on-chain metrics indicator used to identify the average ratio of an asset by dividing the Market Cap with the Realized Cap. It helps to identify when an asset has been overpriced or underpriced.
- **MVRV Ratio under 3 months **
source
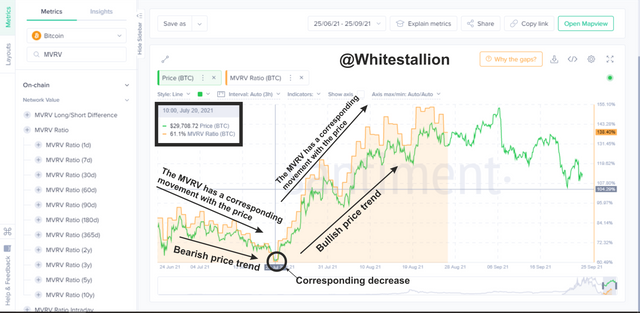
From the image above it is clear to say that the Price of BTC was highly undervalued at $29k, this was also noticed with the decrease in the percentage of the MVRV ratio which fell to %61. TH MVRV also has a corresponding movement with the BTC price. Also when there was a peak in price at $42k, the MVRV had a corresponding increase which also peaked at %121.
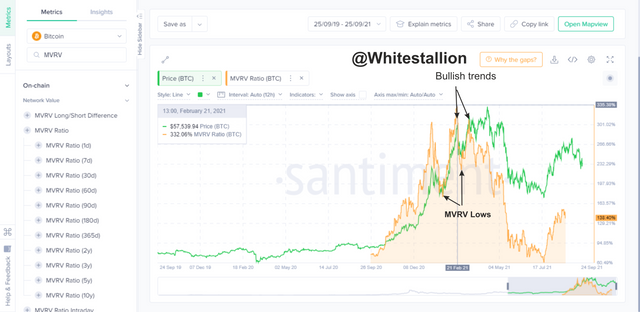
- MVRV Ratio under 2 years

From the chart above, the BTC Price and the MVRV move in a corresponding direction. But looking at the chart above the MVRV ratio line seems to affect the price of BTC each time it drastically peaks far above the price and also there is a price increase when the MVRV has a huge decline.
Question 3
Is the MVRV ratio useful in predicting a trend and take a position? How reliable are the upper threshold and lower threshold of the MVRV ratio and what does it signify? Under what condition the Realized cap will produce a steep downtrend? Explain with Examples/Screenshot?
- How useful the MVRV ratio is in predicting a trend and taking a position
The MVRV is a leading On-chain metrics indicator that suggests or identifies when an asset is deemed over or undervalued by dividing the Market Cap by the Realised Cap. Using the MVRV on a long-term scale is ideal to achieve maximum result because you will need an extensive historical build of the Realized Cap and Market Cap of an asset to ascertain a successful result.
The MVRV on-chain metrics indicator has a scaling spectrum that runs from 0-100 and above, but when the price is below the %100 regions, the asset is considered undervalued which may initiate a bullish trend, also when the price cross over the %100 region the price is considered overvalued, this may trigger a bearish price movement.
- Upper threshold of the MVRV ratio
source
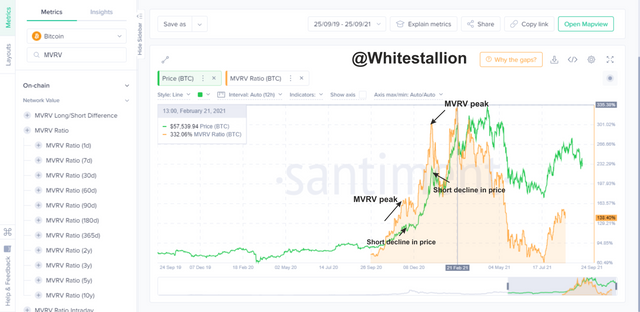
The Upper Threshold is not so reliable in the sense that a huge increase in the MVRV ratio only triggers a short retracement in the market, and this data will be less profitable for long term traders who want to enter the market. The Upper threshold signifies a bearish trend or a price decrease.
- Lower threshold of the MVRV ratio
source
The Lower threshold is more reliable because there is always a strong bullish trend in the Lower threshold of the MVRV ratio. The Lower threshold signifies a potential price increase.
- Under what condition the Realized cap will produce a steep downtrend
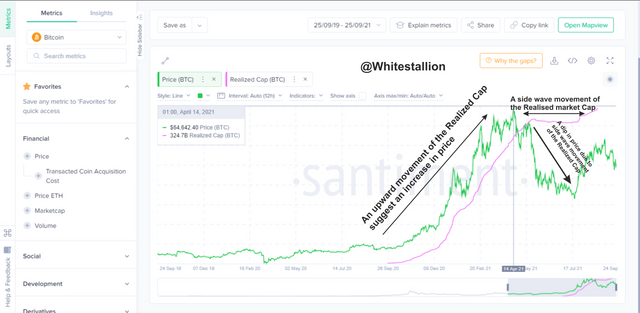
source
The Realized market Cap is the total value of the whole UTXO of an asset. This means that the Realised Cap line cannot have a decrease due to a continuous influx of new crypto investors in the market.
The Realized Cap line has two major movements which are an upward diagonal or sideways movement. The upper diagonal movement suggests an Uptrend or a price increase, while the sideways movement suggests a downtrend or decrease in price due to investors losing confidence in the asset.
Conclusion
The Realized Cap tries to evaluate the overall value of all the UTXO of an asset while the Market Cap evaluates the total value of an asset by multiplying it with the price of its single unit. The MVRV ratio is used to know when the price of an asset is over or undervalued by dividing the Market Cap with the Realized Cap, it is also used to identify entry and exit levels for long-term traders. These On-chain metrics indicators are good for making analysis but it is also ideal to incorporate the use of other indicators to achieve a better result.
Thank you Professor @sapwood for the amazing lecture.