Crypto Trading With Williams % R Indicator: Crypto Academy Season 4 [ Advanced course ] week 4 for Professor @kouba01
Hello friends and welcome to my assignment task by professor @kouba01, in this assignment I will explain the basis of Crypto Trading With Williams % R Indicator, I hope you enjoy and learn from my assignment.

Question 1
Explain the Williams %R indicator by introducing how it is calculated, how it works? And what is the best setting? With justification for your choice.
What is the William %R
The William %R is an Oscillator that helps to identify the Overbought and Oversold of an asset using the -20 and -80 levels. Also Known as the Willian Percentage Range, it was founded by Larry Williams in 1973.
The William %R moves between 0-100 levels with -20 and -80 being its overbought and oversold regions respectively. When the oscillator moves above or below the overbought or oversold region it does not necessarily mean that there will be a reversal in price, it means that the price has reached the levels of its recent range. Nevertheless, the William %R can be used to identify entry points in the market and also trend reversals.
How is the William %R calculated
First, we have to note that the William %R uses a 14 days default period.
Therefore, William %R = (Hpp - CP)/(Hpp - Lpp) x 100
where:
Hpp - Highest price within the period
CP - Closing Price
Lpp - Lowest price within the period
For example, if we were using the 14 day default period if the Highest price of Huobi Token is at $12 and the lowest price is at $6 and its closing price was $8. Therefore to calculate the William percentage Range it would be as follows:
William%R = (12 - 8)/(12 - 6) x -100
William%R = (4)/(6) x -100
William%R = 0.66 x -100
William%R = -66%
What is the best setting? With justification for your choice
As stated before the Willam %R was built by Larry Williams using a default 14 day period, but the best setting is based on the type of trader and strategy used, for example, a Swing trader would prefer a lesser period than a Position trader. But regardless of the period in use by the trader, a constant reset of the indicator should be carried out till the trader finds a suitable period that would provide concrete results.

Question 2
How do you interpret overbought and oversold signals with The Williams %R when trading cryptocurrencies? (screenshot required)
Overbought signal
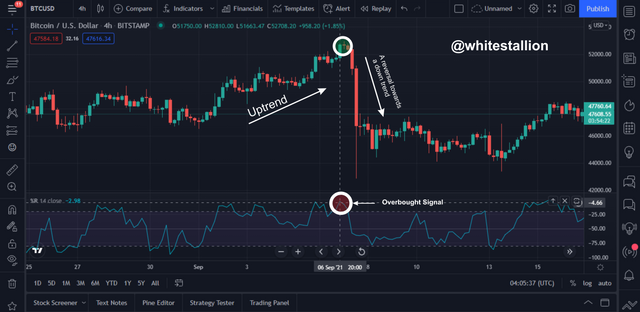
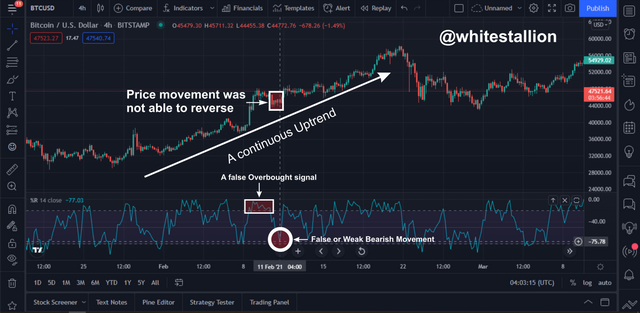
An overbought signal is identified when price moves within the region of the of 0 and -20% of the William %R indicator, but this does not necessarily mean that there is going to be a change or reversal in the direction of price, that is why it is ideal to wait till price starts to make a reversal or wait for when the %R makes a reversal movement that hits the -20% level, before making an entry into the market. The need to be sure of the reversal in price is to prevent losses in case the price continues an uptrend movement even after surpassing the -20% level.
source
From the Image above the BTC price was in a strong uptrend, This was identified on the William %R indicator when the %R line crossed the -20% level, this signalled a price reversal With the price at $51,485. This signal then initiated a reversal in price movement towards the Downtrend, with BTC hitting a low price of $42,919.Oversold signal
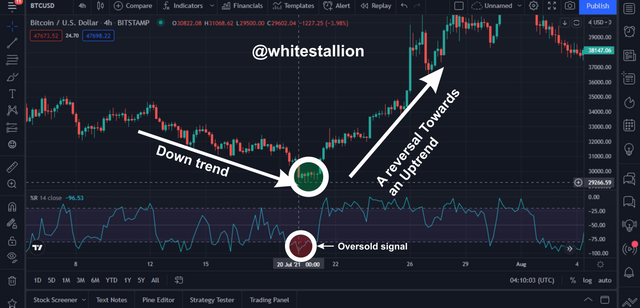
An oversold signal can be identified when the price of an asset has crossed the -80% level, this becomes an oversold signal, but it does not mean an immediate reversal in price, that is why it is ideal to wait for the %R line to make a reversal to the -80% level, or waiting for the price to make a change towards an uptrend before having an entry or confirmation of the price direction.
source
The image shows the change in direction or reversal of the BTC price towards an uptrend after the %R line crossed the oversold region, this signaled a reversal in price which initiated shortly after the price of BTC made a low of $29,172.
Question 3
What are "failure swings" and how do you define it using The Williams %R? (screenshot required)
What are Failure Swings
Failure Swings or False Swings are situations where price makes a counter directional movement from the predicted movement of an indicator, this might be as a result of a weak influx of buyers or sellers on a particular trend, or a weak Bullish or Bearish movement, this will result to the trader taking in losses.
On the William %R indicator failure swings occur when the %R line crosses the overbought or oversold level, but instead of price having a reversal in movement, it however takes a short retracement in a counter direction before engaging back to its primary trend.
Bullish Failure Swing
source
The image above shows the BTC?USDT chart, where the William %R indicator signaled a reversal in the movement of price after the %Rline crossed the oversold region. The price of BTC made a change in direction towards the Bullish trend but then made a quick retracement back to its original bearish trend. This was as a result of Buyers being drowned out by sellers thereby making the %R line also make a reversal back to the oversold region.
Bearish Failure Swing
source
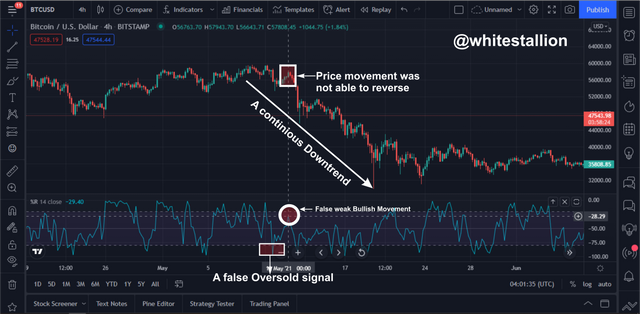
The image above shows the BTC/USDT chart, which shows that the %R line of the William %R indicator has reached the overbought levels, but when the price started to make a retracement there was a reversal back to the Bullish trend. The Williams %R line could not reach the -80% level but rather stopped at the -75% level before making a reversal in direction to the Bullish trend.
Question 4
How to use bearish and bullish divergence with the Williams %R indicator? What are its main conclusions? (screenshot required)
Divergence in Trading occurs when there is a counter-movement in direction between an Indicator and price trend, this often signals a trend reversal that is potentially yet to occur.
**William %R Bullish divergence **
The Bullish DIvergence occurs in conditions why the Price trend moves in a counter direction from the William %R indicator, this signals that a potential Bullish movement is about to initiate.
source
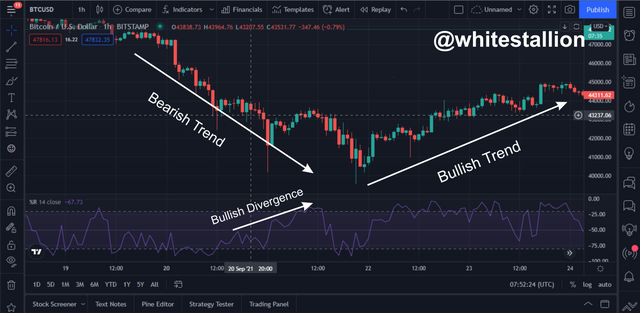
From the Image above the Price of BTC was in a downtrend while there was a Bullish divergence or movement with the William %R indicator, this signals potential a Bullish signal which was later initiated.
William%R Bearish divergence
The Bearish divergence occurs in conditions where the price moves in an uptrend while the William %R indicator moves in the Bearish direction, this is then followed by a trend reversal towards a Bearish trend after a while.
source
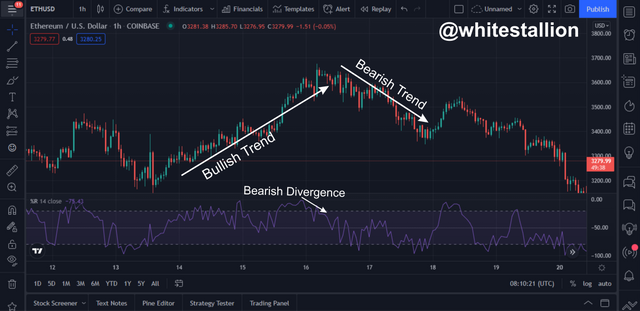
From the image above, the ETH/USDT chart shows a Bearish Divergence or movement of the William %R indicator while the market was still in an uptrend, This signals a potential Initiation of a downtrend which later was initiated.
Question 5
How do you spot a trend using Williams %R? How are false signals filtered? (screenshot required
How to Spot a Tren Using THe Williams %R indicator
To spot a trend firstly the price should move in a corresponding direction with the William %R, also in a Bearish trend, if the %R line cross below the -50% level it is deemed that the trend is strong, also in a Bullish trend if the %R line crosses the -50% level it interprets that the trend is strong.
How are false signals filtered?
When the William %R line Crosses the -50% level in either direction of a trend it helps clarifies how strong that particular trend is.
The merging or combination of an indicator with the William %R will also help in enhancing the credibility of the result which in turn helps to filter out false signals.
A Filtered Signal
source
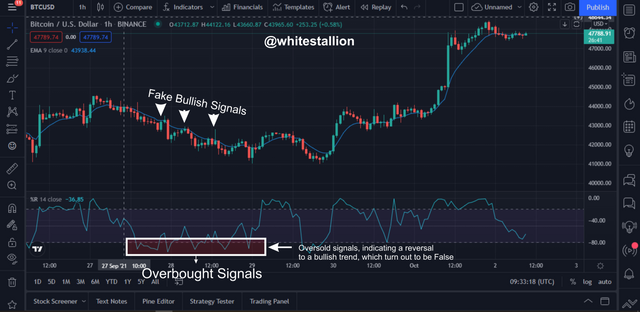
The image above shows fake Bullish signals on the BTC/USDT chart. Using the William %R indicator, the %R line could not cross the -50% level, therefore, indicating that the trend is not strong.
Identification of Correct Signal
source
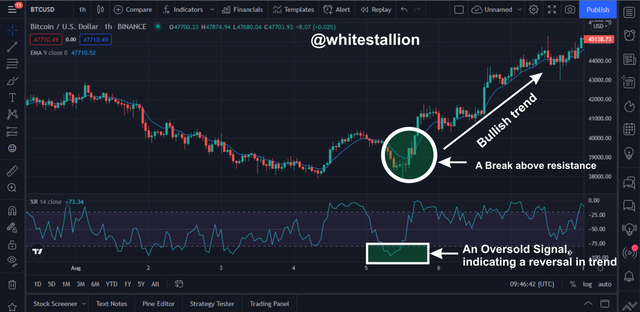
From the Image above it is clear that the William %R line crossed the oversold levels, thereby indicating a reversal in price direction, this was confirmed by the EMA which serves as a support to the price movement, with price breaking out of the resistance level.
Question 6
Use the chart of any pair (eg STEEM/USDT) to present the various signals from the Williams %R indicator. (Screen capture required)
Sell Signal
A sell signal occurs when the William %R indicator has crossed above the -20% level which is the Overbought region.
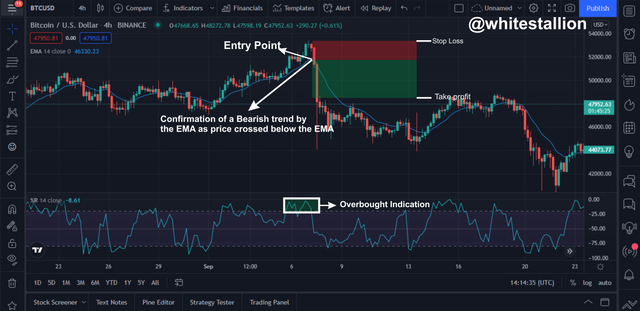
The image above shows that the William %R line has crossed above the -20% level which indicates a reversal in price movement, this was later confirmed by the EMA line after the price broke below it, therefore verifying the sell signal.
The entry point is identified at the region where price moves below the EMA, also the Stop loss and Take Profit is set at a 1:2 ratio respectively as a risk management strategy.
Buy Signal
A Buy signal occurs when the William %R indicator has crossed below the -80% level which is the Oversold region.
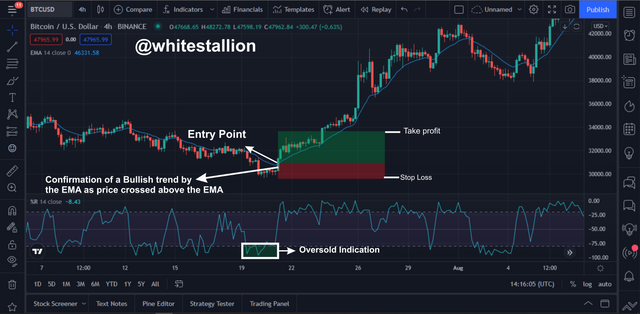
The image above shows that the William %R line has crossed below the -80% level which indicates a reversal in price movement, this was later confirmed by the EMA line after the price broke above it, therefore verifying the buy signal.
The entry point is identified at the region where price moves above the EMA, also the Stop loss and Take Profit is set at a 1:2 ratio respectively as a risk management strategy.
Conclusion
The William %R indicator is used to identify Overbought and Oversold regions of an asset over some time, these regions signifies a potential reversal in price, but it does not always mean that price will completely change direction, therefore it is ideal to merge the William %R indicator with other indicators to achieve a more successful outcome. Also, it can be used to know the strength of a trend when the %R line moves over or below the -50% level of either side of the trend.
Special thanks to Professor @kouba01
Hello @whitestallion,
Thank you for participating in the 4th Week Crypto Course in its 4th season and for your efforts to complete the suggested tasks, you deserve a Total|6/10 rating, according to the following scale:
My review :
An article with an acceptable content, where all the answers were not deep in the analysis, despite the fact that they contained useful information, but the interpretation and explanation required opening several dimensions of the question according to a clear methodology.
Thanks again for your effort, and we look forward to reading your next work.
Sincerely,@kouba01