Crypto Academy / Season 3 / Week 3 - Homework Post for [cryptokraze]- Break Retest Break (BRB) Trading Strategy

Hello friends and welcome to my crypto academy assignment here and we will be talking about Retest Break (BRB) Trading Strategy, which is a very popular and successful trading system used by many traders around the world. Let's take a look closer at this trading Strategy with chart examples.
We will start by isolating the keywords there like Break, Retest, and Break. Let's go over them one after another to get a clear picture of what we talking about.
1 - What do you understand about the Concept of Break Retest Break Strategy? Give Chart Examples from Crypto Assets.
Break
When we talk about a break, obviously from the word break we breaking something, we surely not breaking a coconut, clearly No, rather we are breaking support or resistance levels, this means we could either break to the upside or to the downside, whichever direction price goes we definitely going to have a break.Retest
Talking about retest, we know that the market doesn't move in a straight line this is true in a bull market or a bear market. when price moves either to the upside or to the downside we are definitely going to see price retest(come down in a long scenario and comes up in a short setting) resistance levels in a bullish scenario and support in a bearish scenario. so since the market doesn't move in a straight line we always going to see price retest or revisit previous support or resistance levels.Break
This kinda breaks is quite different from the one mentioned above when we trading in this sequence. This break is the continuation of the first break in this trading sequence. When price makes an impulsive move(initial break) either to the upside or downside breaking major levels, we always see a restest of these levels. if the existing bullish trend or bearish trend is strong enough, we will see a further continuation, which is the second break.
Break Retest Break (BRB) Trading Strategy
Break Retest Break (BRB) Trading Strategy is a very straightforward strategy if you understand the mechanics and rules. Trading this style involves identifying areas of consolidation or an existing channel in the chart. Anticipating a break and waiting for the price to retest the previous levels of support or resistance than the second break where price continues to trend in its initial direction.
Every candle tell a story
When we see a bullish impulsive move, a retest is expected, and it's very important to wait for restest because sometimes these impulsive moves are false breakouts, it could be a bear trap or a bull trap depending on the market trend, so it's always important to wait for retest and confirmation before going all-in in a trade.
Why do we see retest? Every candle tells a story of demand and supply, it tells the trader's reactions and their actions, so why do we see a retest - when a bullish breakout happens, some buyers rush to buy the asset and some buy stops are triggered. As the price rises continue to climb some buyers will start taking profit, this causes the market to plummet to the previous support where buyers waiting to join the trend gets their orders triggered and this pushes the price significantly higher.
Chart Examples
TradingView

TradingView
Break Retest Break (BRB) is applicable both in long and short trades, it is found almost everywhere in the chart and it works in several popular chart patterns such as:
Consolidation - After a long period of consolidation, a break is imminent either to the upside or downside, in these cases we always see a break and retest.
Channels - Price may form a diagonal or horizontal channel and the price is most likely to have a break and retest.
Wedge - In most cases, a break and retest occur when the price is about to break out of a rising or falling wedge.
Triangle - Breaking out of a symmetrical, ascending, and descending Triangle often involves a break and retest of support and resistance levels.
Risks
- One of the risks of using this strategy is that sometimes price breaks a resistance, retests, and continues dropping instead of seeing a bullish continuation.
- Sometimes price breaks out and continues rising without retesting resistance. This could lead to missing out on big moves.

2 - Mark important levels on Crypto Charts to trade BRB strategy. Do it for Both Buy and Sell Scenarios.
Like I said at the beginning of this post, price break, and retest key levels, your thesis as a trader is based on how price reacts on these key levels. Let's explore important key levels that contribute to the success of this strategy.
Support levels
Support is a price level where a bearish trend can be expected to halt due to a concentration of demand or buying interest. As price approaches a support level the selling pressure is absorbed by buyers who are waiting at these levels to enter the market. These levels are clearly visible in a chart due because of how price reacts when it gets to these levels. When a support level is broken, it becomes a resistance overhead. At a support level, price could either do two things,
It could see a strong rebound or reversal at these levels because of more buying pressure from the buyers.
Or it could smash through the support level and challenge the next support level below. This is a result of more selling pressure from sellers.
Chart Examples for Support Levels
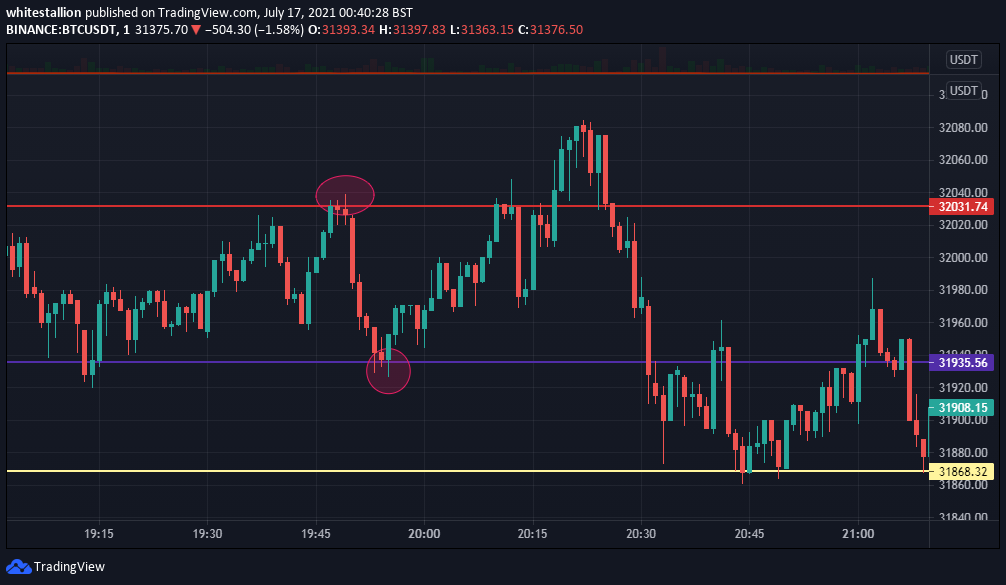
TradingView
In the above chart example we have marked out our support levels using the horizontals. We have our support levels at the yellow horizontal (31,868), purple horizontal (31,935), and at the red horizontal (32,031). Its important you first mark out your support horizontals first before staring your anaylisis because they're the foundation of the stragey.
Buy screnario

TradingView
In this scenario we will be playing with the purple and red horizontal.
We can see price respecting the support levels both at the purple and red level.
A buy opportunity will start at point 1, a bearih candle kicking below the support level and an immediate bounce above the support and made a move to the origin of the impulsive move.
We got confirmation when the next candle at point 1 retested the support level again, as shown in the chat above.
We got the second break, which pumped from point 1 to point 2
We got a second retest of the support once again, which is a good entry point for long trader aitibg to enter the market.
Followed by another move to the previous highs by creating series of higher highs and lower lows.
Sell screnario

TradingView
A sell opportunity will start at point 1, a bearish candle kicking below the support level and an immediate bounce above the support and made a move to the origin of the bearish impulsive move.
We saw a break down below the support level, at point 1 which the red candle clearly depicted.
We saw a retest of the red horizontal, showing strong selling pressure from sellers who pushed the price down further to another support level below.
We had a bearish impulsive move break the purple horizontal.
We had a first retest and also a retest at 3,4,5 and 6, before seeing further bearish continuation and broke the yellow support region.
Quick Tip - The more a support level gets retest, like in the case above, the more likely that support level will not hold.
Resistance levels
Resistance describes a level where an uptrend is expected to halt temporarily, due to the concentration of buyers who want to enter the market.
As price approaches a resistance level the buying pressure is absorbed by sellers who are waiting to take profit and exit the market.
At a resistance level, price could either do two things,
It could see a strong rejection at the resistance and reverse to support level below.
Or it could break through the resistance level and challenge the next resistance level below. This is a result of more Buying pressure from buyers.
Chart Examples for Resistance Levels

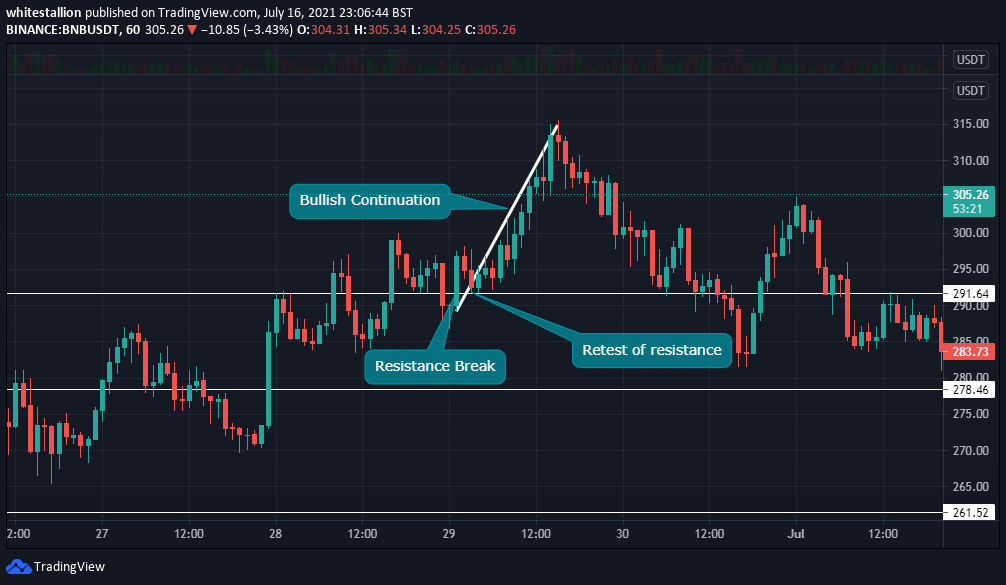
TradingView
In the above chart example, we have marked out our resistance levels using the white horizontals. We have our resistance levels at the white horizontals marked at $311 and $303. The price movement in the chart above shows clearly how price is respecting the horizontals above.
Buy screnario

TradingView
In this scenario we will be working with the two white horizontals.
We can see price activity in the zone marked out in the chart. Price kept contesting the resistance level and kept getting rejected, we eventually saw a breakthrough.
We saw a retest of the recently broken resistance level, we saw a retest at 1,2,3.
We saw further continuation to the upside, after the last retest.
Sell screnario

TradingView
- We saw a bullish move to the resistance as depicted on the first trend line.
*We got a strong rejection after price tried breaking the resistance level overhead.
We saw a retest of the resistance as the bulls tried to contest for the region once again.
After the rates, we saw a break to the downside, a very bearish impulsive move all the way to $290 level.
3 - Explain Trade Entry and Exit Criteria for both Buy and Sell Positions on any Crypto Asset using any time frame of your choice (Screenshots Needed)
Identifying where to enter the market and where to exit a market is an invaluable tool that every trader needs to develop no matter their trading strategy. It's one thing to enter a trade and another to know when to exit the market, using the break, retest, and break strategy let's analyze how we can get our entry and exit points.
Making an Entry
The first step to take before entering a position either long or short is to mark out your Supply and demand, your support resistance levels.
Identify the existing trend and key price actions.
Wait for price to approach and break your levels, these levels should be marked out and very visible in your chart.
Wait for a retest of the marked ou levels. It's important you wait for retests.
Wait for confirmation, price must break the recently formed high.
Enter a position just above the recently formed high, and ride the trend to the next pivotal levels.
Buy examples

ADA/USDT 1H timeframe
I have my horizontals marked out with my resistance and support levels marked out.
We saw an impulsive move to the upside but had to wait for a retest of the resistance which we got.
Wait for a valid bullish structure after the retest, which we saw.
Enter at the most recently formed high, ride to the top, and new resistance level.
Sell examples

ADA/USDT 1H timeframe
Mark out your horizontals, with a clear picture of your support.
Pay attention to how price reacts at your levels after an impulsive move below the support level.
Wait for a retest of the support level
Enter at the most recently formed low after the retest.
Making an Entry
It's important traders mitigate their losses by setting stop loss on their trades in case their setup is invalidated.
Your stop loss should be above your support horizontal.
If prices do not respect your levels, it's best to exit your position in order to cut down your losses.
If the price goes your desired direction, you must set your take profit so you can book profit before price challenges a new level.
Take profit level should be 1:1 RR (Risk: Reward).
Buy examples

BTC/USDT 1H timeframe
- After we saw a bullish breakout and a retest too, we saw price move from point 1 to point 2 which is clearly the next resistance level.
It's best to book your take profits at the next resistance level, once you book your profit, you should leave the market and examine price action.
Sell examples
ADA/USDT 1H timeframe
- We saw a bearish break to the downside, a retest, and further continuation until the price hit lower support levels.
4 - Place 2 demo trades on crypto assets using BRB Strategy. You can use a lower timeframe for these demo trades (Screenshots Needed)
Imploring this strategy in one of the test trade's I took today. I tried practicing the break and retest strategy.

I made a simple analysis, I identified the resistance levels in the chart, with special emphasis to the orange marker.
I saw a break of the resistance level, a retest and I entered in the next high which is at $1900.
The next resistance level is at $1903, so I set my take profit at that level.

The outcome of the trade.
All the images used in post are original extracts from trading view by @whitestallion.
Conclusion
Break, Retest and Break is a great strategy and I have come to understand this strategy with each letter I typed. It's simple and straightforward engaging simple concepts like support and resistance levels. I will be adopting this approach and adding it to my trading style.
Dear @whitestallion
Thank you for participating in Steemit Crypto Academy Season 03 and making efforts to complete the homework task. You got 6/10 Grade Points according to the following Scale;
Key Notes:
We appreciate your efforts in Crypto academy and look forward for your next homework tasks.
Regards
@cryptokraze
Thanks for the review and corrections. 😊😊