Crypto Academy /S5W7-Homework Post for kouba01

Hey guys,
I welcome you'll to the 7th week of the SteemitCryptoAcademy course by Professor @kouba01. In this course, I will run a comprehensive review on Crypto Trading With SuperTrend Indicator.
All images used in this post unless otherwise stated are not mine and were extracted from Tradingview for the purpose of this assignment.

Question 1
Show your understanding of the SuperTrend as a trading indicator and how it is calculated?
The SuperTrend indicator is an attempt to have an indicator that surpasses every other indicator, one that is reliable to a greater percentage than any other indicator. The goal of an indicator is to spot trends on time and aid traders to jump at trends in anticipation for movement in their direction, the idea of SuperTrend indicator is to give a near-accurate prediction.
My typical way of defining a concept is to split the concept into its salient part; in this case, being “super” and “trend”. The idea of “super” connotes something stronger in comparison to another. This strength is what is captured in the above paragraph on the indicator being more reliable than any other indicator. The “Trend” in the term connotes that it is an indicator that follows trends. This brings to mind the Moving Average indicator which is also a trend follower. How both are similar is that they function by registering movements in the market and reflecting current prices. In my words, I would say it tunes out the noise in market movement by focusing on the mean (the average between the highs and lows) and the fluctuations in the market.
To best understand the SuperTrend Indicator, I use this image below to define it:
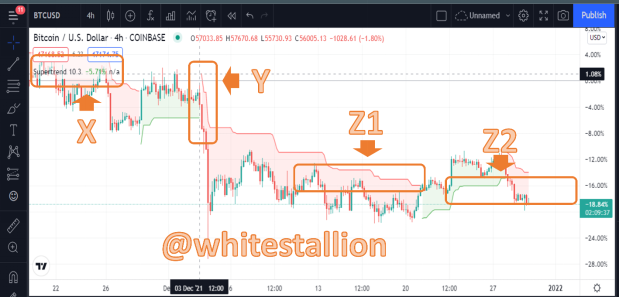
As can be seen from the image above, there are four identified markings labeled X, Y, Z1, and Z2. In my opinion, explanations of these are what would show an understanding of supertrend indicators.
X is an indication of the addition of the SuperTrend indicator on my Trading View Account, it also shows numbers, what is keen amongst these numbers are the numbers: 10 & 3. They make up what is known as parameters, and 10 and 3 are the default parameters. I would avoid delving deep into the discussion on parameters as the next question tackles this.
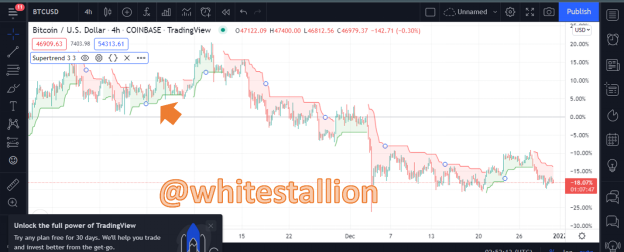
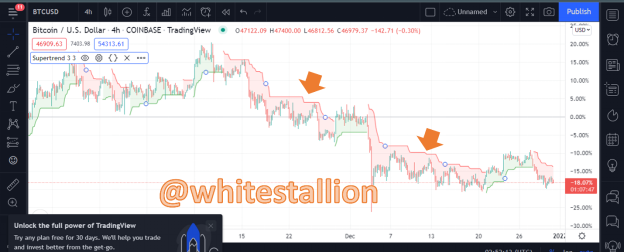
Y is an indication of instances in which the SuperTrend indicator is efficient in capturing fluctuations and deviations.
This can be seen in price immediate movement to the downside, which the Supertrend indicator highlights in the circled line. It begins with a statement of the initial price and then a direction. This is why the class exposition states that the two most important parts of the indicator are: color and direction. Colour can either be red or green and shows initial price status while the direction is the movement the red or green line follows. Z1 is an instance of a red line, indicating that price is bearish, and Z2 above is the opposite.
To calculate the Supertrend, there is a guiding formula:
In an Uptrend: (HIGH + LOW) /2 + MULTIPLIER/FACTOR x ATR
In a Downtrend: (HIGH + LOW) /2 - MULTIPLIER/FACTOR x ATR
NB: The difference between both is that the average price is added to the volatility in an uptrend, while it is subtracted in a downtrend.
The ATR (Average True Range) is very important in SuperTrend Indicator and to get this, the trader may use the formula: (Previous ATR x 13) + Current TR) / 14 where 14 is the period and would vary.
This formula is what was given in the class exposition where, ATR is seen to be perceived from the trader’s critical view of the closing price of the last candle (Previous ATR), High Price of the Current Candle (Current TR), and the bottom of the current candle.
Question 2
What are the main parameters of the Supertrend indicator and how to configure them and is it advisable to change its default settings? (Screenshot required)
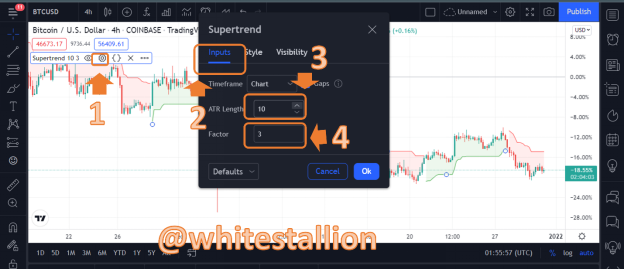
As said above, the main parameters of the SuperTrend indicator are a period of 10 and 3 indicated in the picture (section labeled X) above. Nevertheless, these are not the only parameters but what must be known is that a change to these parameters would affect how the SuperTrend indicator functions in a chart.
To configure the parameters would mean to adjust the parameters on the indicator, and to do this, after adding the indicator on the chart, you scroll to the icon that has its name and click on the “setting symbol”. A popup shows from which we select “Input” and then we can change the ATR Length or/and the Factor. Change of these two things is what changes the parameter of the indicator.
The step is indicated below:
In my opinion, the 10 & 3 parameter is somewhat ideal and easily usable, but it does not mean that it is the best setting as individual taste matters. Nevertheless, before a change in the parameters is made, the trader must note that parameter changes may affect how much the indicator reflects price movements. For instance, small parameters will make more signals obvious because the indicator is made to react more to price movement as seen below:
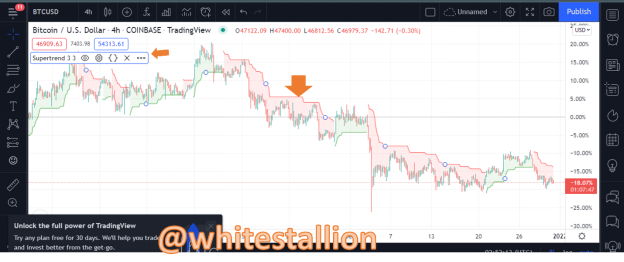
The reason for the above chart drawn on a 3 & 3 Parameter is because the indicator has been set to be more reactive to price movements. While bigger parameters show fewer trading signals because they are less reactive to price movements, as seen below on a Parameter of 10&10:
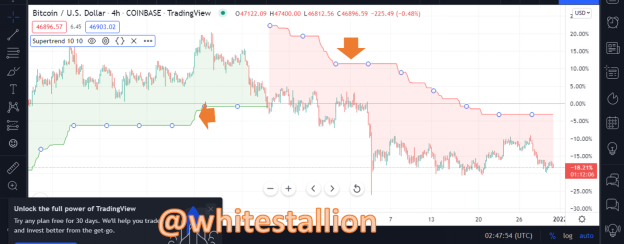
If you compare both parameters, in the high and low configuration, then one can see that the last short in the first picture is more pronounced than as it is in the second picture. This is the effect of the parameter’s choice.
Question 3
Based on the use of the SuperTrend indicator, how can one predict whether the trend will be bullish or bearish (screenshot required)
The goal of indicators is to predict trends in anticipation. Because indicators focus on filtering the market’s noise and focusing on movements, the major price movements are pronounced, and it is often easy to tell that the market is bullish or bearish by looking at the major movements. However, the bigger question is how one can use the SuperTrend Indicator to predict whether a market movement is going to become Bullish or Bearish.
The general rule for spotting a bullish trend with a SuperTrend indicator is to spot a rising line (typically green but can be edited based on users’ preference).
The green line in the above picture in an upward movement indicates a bullish trend, while a bearish trend is indicated by a steep movement or a movement in the downside (typically red but can be edited based on users’ preference).
However, what is of interest here is the key area in which to expect a reversal towards a bullish or bearish trend or perhaps a continuation. My conclusion here is that with the SuperTrend indicator, the rule for predicting bullish or bearish trend is that:
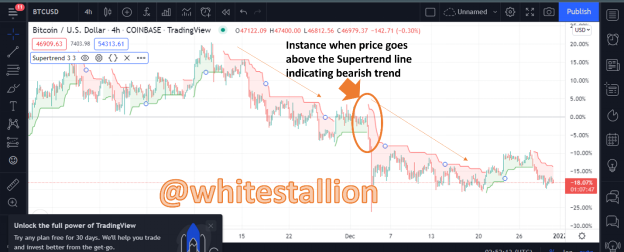
The trend will be bullish if the price remains traded above supertrend line. So, if the price remains above supertrend line, then one can say a continuation is going to happen.
Nevertheless, immediately there is a deviation from the price being above the supertrend line, then there is a bearish trend in anticipation. A bearish trend is predicted when the price in the bullish run goes below the preceding supertrend line as indicated below.
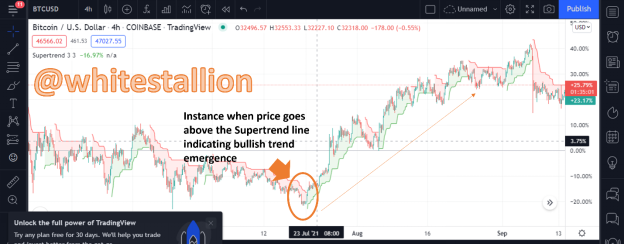
- To predict a Bullish trend in a Bearish market, the reverse is the case. When the price breaks above the Supertrend line, then a bullish trend is to be anticipated. See below:
Question 4
Explain how the Supertrend indicator is also used to understand sell / buy signals, by analyzing its different movements.(screenshot required)
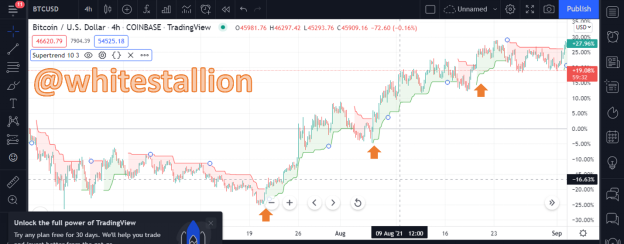
The notion here is that by the functioning of the SuperTrend indicator, a trader can be able to find signals in which to enter in a buy or sell position (basically entry). It is quite simple. If you take the explanation of spotting bullish and bearish trends before they happen, you know that there will be a change on the chart indicating that the trend is about to be formed. How you know if it is a buy or sells signal is in two basic features. For the buy signal, a green SuperTrend line is often present, and it is seen to cut below a candlestick. At the point it crosses is the buy signal. The Stop Loss here can be placed on the red line preceding the buy signal. See below the arrow points for Buy signals:
- For the Sell Signal, the supertrend line (usually red) sits above the candlestick, the exact reverse of the buy signal, indicated below:
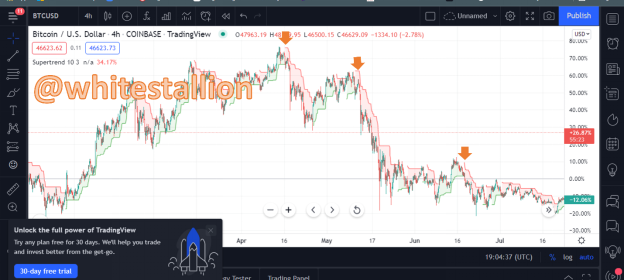
- For the Sell Signal, stop loss can be placed at the green indicator line preceding the sell signal. It is important to note though that the green and red lines are default colors and can be altered to the user’s preference.
Question 5
How can we determine breakout points using Supertrend and Donchian Channel indicators? Explain this based on a clear example. (Screenshot required)
A Breakout point is a point on the chart where the price is shown to break support or resistance protocols, the general rule is that when resistance is broken, the trader should approach the market above the breakout in a buy, and when it is a support level broken, a sell is to be placed below the breakout.
The notion here is that SuperTrend and the Donchain Channel Indicators can help determine breakout points. The Donchain Channel indicator is an indicator comprising of three lines usually upper, middle, and lower bands, the upper marking the price of a security at its highs, the low, at its lowest, and the median being a mid-range.
- One thing that has been consistent throughout this article is the fact that the SuperTrend serves to filter market waves and just show major movements. When paired with the Donchain Channel, it becomes a trend filter. It looks like this:
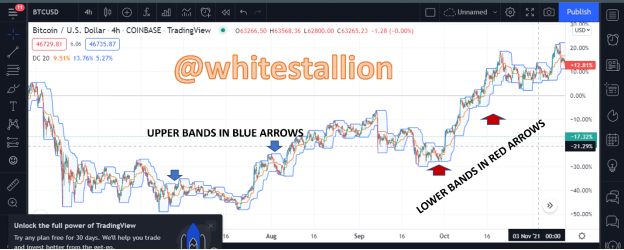
- It works bearing a rule in mind, which is that a buy signal trend is initiated only when the upper wave is broken and that a sell signal trend is to be expected when the lower wave is broken. For example:
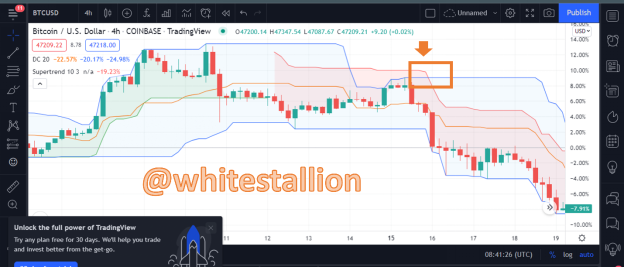
- Spot the breakout labeled in the above picture where the Donchain channel cuts through the SuperTrend Indicator sending it downwards, indicating a breakout to a downtrend. When the Upper Wave on the Donchain channel is intercepted by the Supertrend indicator, then a breakout is imminent.
Question 6
Do you see the effectiveness of combining two SuperTrend indicators (fast and slow) in crypto trading? Explain this based on a clear example. (Screenshot required))
Yes, it is effective to combine two SuperTrend indicators, however, what must happen is that the combined supertrend lines must be a meeting of one fast parameter and one slow one. For example, the main parameter 10&3 known to be a slow parameter, and a faster parameter, let’s say 19 and 2, looking like the below:
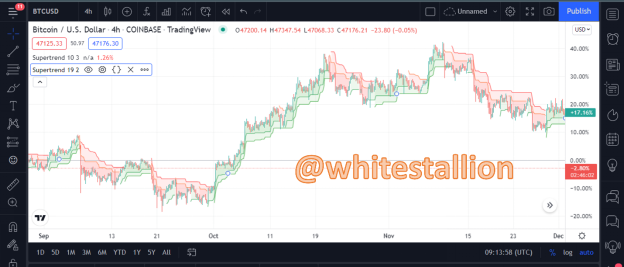
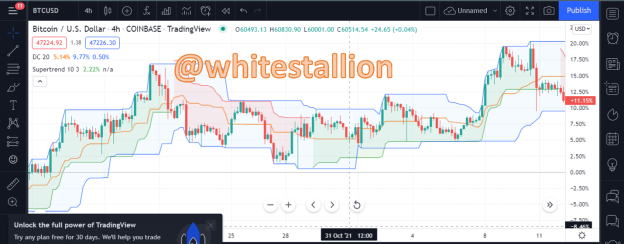
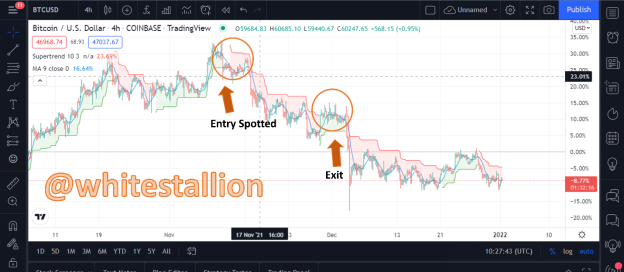
- The way to use this is to spot for instances to enter the market is to spot for where the fast curve and the slow curve which generally do not meet, meet in such a way that the fast curve is above the slow (this is an entry), and when it is below, we have to look out for the two supertrend indicators changing colors to their opposite (red to green or vice versa), then it is time for an exit. Let’s take a look at the below:
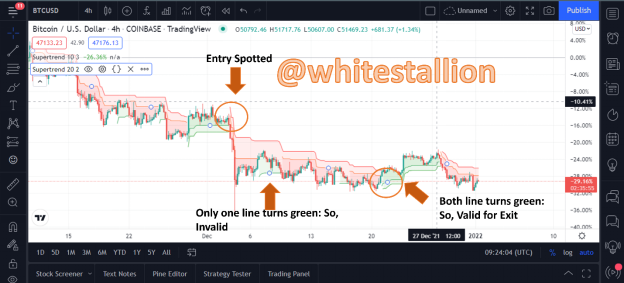
- The above picture has two SuperTrend indicators, with a slow parameter 10&3 and a Fast Parameter 20&2 and it is in a short position where the market is largely bearish. Having identified the entry spot, where the fast parameter meets the slow, we can notice that only one parameter turns green after a while, indicating that it is a false exit, but later, both parameters turn green, indicating an exit time. All that is needed for entry is a contact between the fast and slow parameters line for the Super Trend.
Question 7
Is there a need to pair another indicator to make this indicator work better as a filter and help get rid of false signals? Use a graphic to support your answer. (Screenshot required)
I am yet to find an indicator that works best in isolation. Most indicators work best when paired with one another, and the SuperTrend indicator is no different. In the class, the use of the Parabolic SAR indicator was preferred by the lecturer, another indicator that can be used is the Stochastic indicator which helps identify exit. However, my favorite indicator to pair is the Moving Average strategy. If one would recall, earlier the Moving Average was said to be similar to the SuperTrend indicator in this piece of work, however without beating around the bush on what the Moving Average is as this has already been done, the benefit of the combination is that it helps to verify short and long instances. The guiding rule for the combination is that the trader is expected to Buy when the price is above the supertrend and the moving average and the position is to be held until this changes. Just like below:
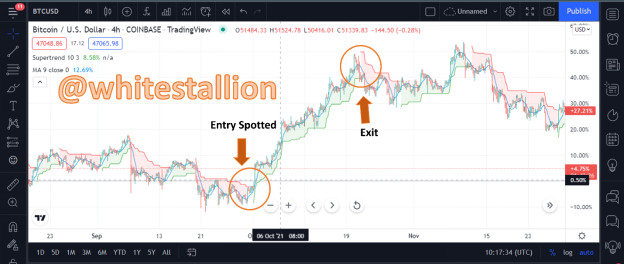
- Sell or go short when the reverse is the case, that is when the price is below the supertrend indicator and the moving average. Easy!
Question 8
List the advantages and disadvantages of the Supertrend indicator
Having studied the SuperTrend Indicator as a trend monitor, these are what I find to be the advantages and disadvantages:
PRO
1.Supertrend shows accurate signals at a given time precisely.
2.It is simple to understand and use.
3.It encourages quick decisions by the existence of guiding rules that tell when to go into the market and when to stay out as discussed in the third question.
4.The SuperTrend indicator is pivotal for recognizing major movements
CONS
1.It is not suitable for all market phases.
2.It works only when the market is trending and may be slow to give entry spots.
Conclusion
The SuperTrend indicator is a rather simple tool in trading from all that has been witnessed here. From the above paragraph, we can see that it has more advantages than disadvantages making it an easy instrument for traders to wield in market analysis.
I always like to add that traders should not rely alone on technical tools but give room for fundamental analysis of the exchange.
Special thanks to Professor @kouba01