Crypto Academy / Season 3 / Week 4- Homework Post for Professor @cryptokraze - Topic: Trading The Dynamic Support & Resistance.
Hello everyone, welcome to week 4 of Crypto academy's season 3. In today's lecture, professor @cryptokraze while teaching on the topic "Trading The Dynamic Support & Resistance" explained to us the concept of dynamic support and resistance and how it is applied in trading. Below is my response to the assignment he gave after the class.

PS: Check out this article about Anchor Bible Verses from Scripture Savvy
Question 1: WHAT DO YOU UNDERSTAND ABOUT THE CONCEPT OF DYNAMIC SUPPORT AND RESISTANCE? GIVE CHART EXAMPLES FROM CRYPTO ASSETS. (Clear Charts Needed)
To better understand the concept of dynamic support and resistance, we must first understand the terms resistance level and support level, and what these levels represents in a price chart.
Resistance and support levels are those levels in a price chart, where the market is likely going to reverse. For instance, once a market that is going in the upwards direction gets to the resistance level, the market reverses and start moving in the downwards direction. In like manner, once a market that is going in the downwards direction gets to the support level, the market reverses and start moving in the upwards direction. Both the resistance and support level are setup by the actions of buyers and sellers.
Looking at a price chart, it is very obvious that the market follows a diagonal line which is either going in the upwards direction or in the downwards direction. This line is referred to as a trendline, and it is drawn diagonally in a price chart from swing points. When a Bullish Trendline is drawn on a trade chart, its swings points creates a type of support level known as a dynamic support level. In the other hand, when a Bearish Trendline is drawn on on a trade chart, its swing points creates a type of resistance level known as a dynamic resistance level.
dynamic resistance: trendlines
Based on this, we can define Dynamic support and resistance levels as those areas in a trade chart where the price of an asset mostly reacts to as it is moves in an upward or downward direction.
Apart from the use of trendlines to represent diagonal support and resistance levels, they can also be represented using moving averages. I will be explaining Exponential Moving Average below.
Exponential Moving Averages (EMA) is one of the moving average indicators. It measures the market by adding up all the close prices of an asset within a specified period and then dividing it by the number of the specified period. EMA is one of the most important indicators in crypto trading, as it helps cryptotraders to identify with ease the market's best entry and exit points, by pointing out dynamic resistance and dynamic support levels.
IDENTIFYING DYNAMIC SUPPORT LEVEL USING EMA
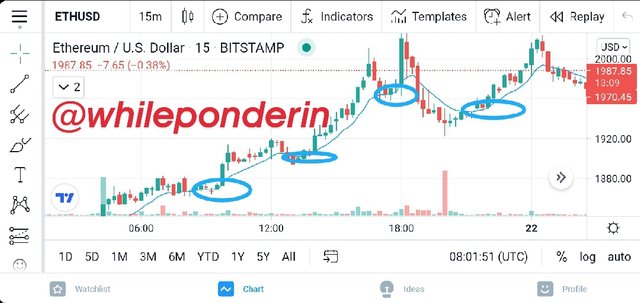
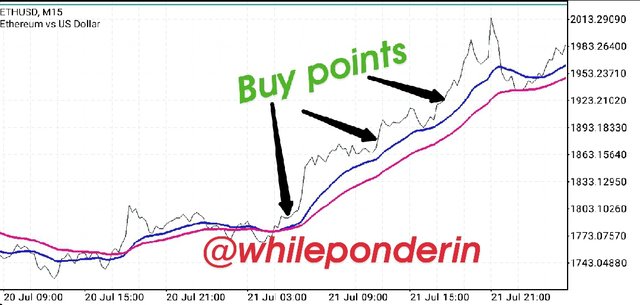
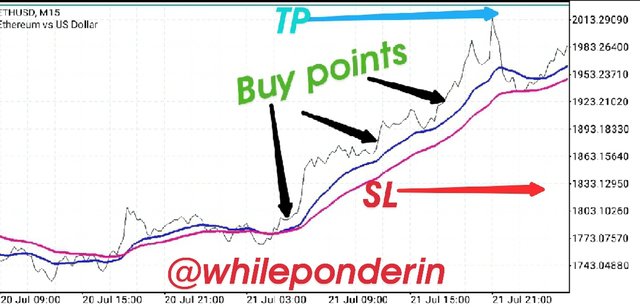
When EMA is drawn on a market chart that is going on the upwards direction, it reveals to us the areas where the market reacts to before continuing it's upwards movement. Looking at this area, you will notice that the market which is generally moving in the upwards direction may be experiencing a retraction (ie changing temporary to downward direction), but once it falls to this swing point identified by EMA, it kind of "bounces" off, and begins to move again in the upward.
This can be seen in the Ethereum chart (ETH/USD) below.
Note: that the price doesn't fall below the identified support point.
IDENTIFYING DYNAMIC RESISTANCE LEVEL USING EMA
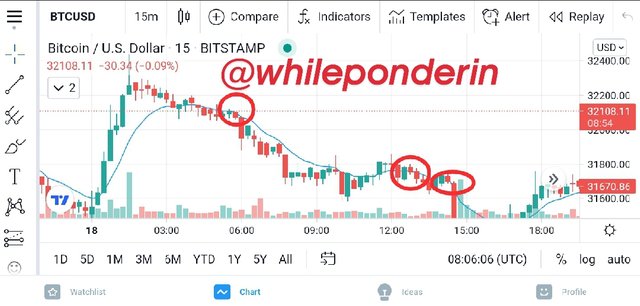
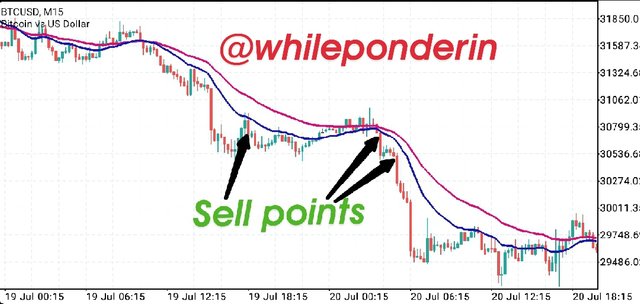
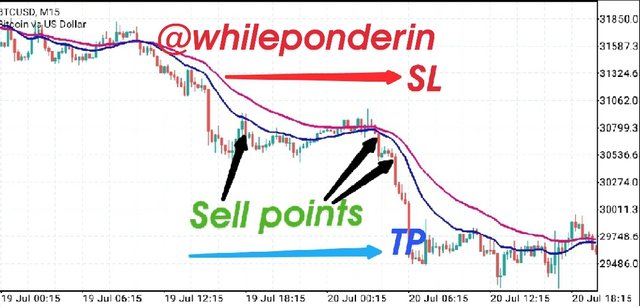
When EMA is drawn on a market chart that is going on the downwards direction, it reveals to us the areas where the market reacts to before continuing it's downward movement. Looking at this area, you will notice that the market which is generally moving in the downward direction may be experiencing a retraction (ie changing temporary to upward direction), but once it rises to this swing point identified by EMA, it is prevented from crossing over, thus it corrects itself and begin to move again in the downward.
This can be seen in the Bitcoin chart (BTC/USD) below.
Note: that the price doesn't rise above the identified resistance point.
Question 2: MAKE A COMBINATION OF TWO DIFFERENT EMAs OTHER THAN 50 AND 100 AND SHOW THEM ON CRYPTO CHARTS AS SUPPORT AND RESISTANCE.
Although one EMA is enough to identify dynamic support and resistance points, it's more advisable to use two EMAs with different periods together on a chart. This is because, two EMAs identify stronger and better dynamic supports and resistance, and any trader who knows these strong swing points can maximize his trading opportunities while at the same time minimizing risk.
To illustrate this, I will be combining EMAs with 20 and 40 periods EMAs. The 20 period EMA is represented by the blue line, while the 40 period EMAs is represented by the red line.
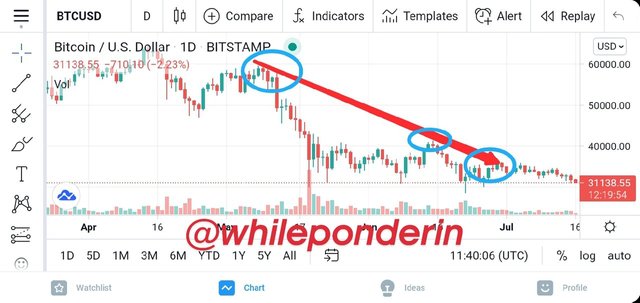
When I applied the 20 and 40 EMAs on a downtrend chart, it indicated strong dynamic resistance levels at swings points that respected both EMAs. This can be seen in the chart below.
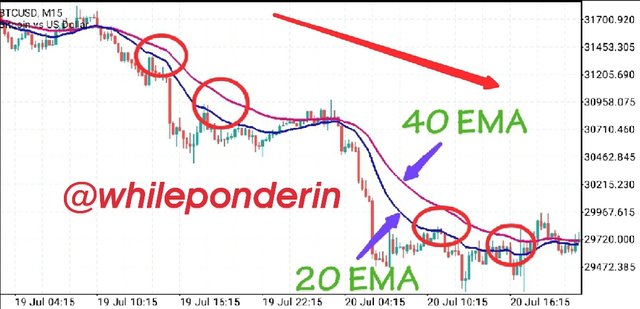
Dynamic Resistance, 20 and 40 EMA
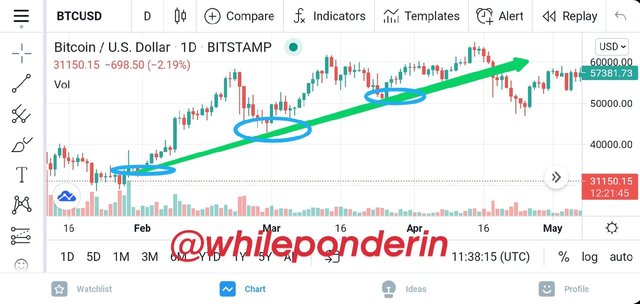
When I applied the 20 and 40 EMAs on a uptrend chart, it indicated strong dynamic support levels at swings points that respected both EMAs. This can be seen in the chart below.
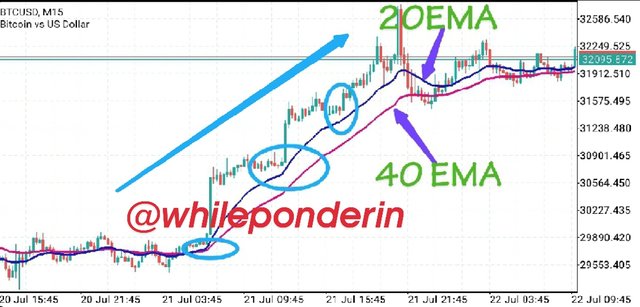
Dynamic Support, 20 and 40 EMA
Note:- Exponential Moving Average can only tell the dynamic support and resistance levels of a trending market. When it is applied on a sideways market, it appears intertwined with the price chart. This indicates the price of the market is not steady.
Question 3: EXPLAIN TRADE ENTRY AND EXIT CRITERIA FOR BOTH BUY AND SELL POSITION USING DYNAMIC SUPPORT AND RESISTANCE ON ANY CRYPTO ASSET USING ANY TIME FRAME OF YOUR CHOICE
To answer this question, I will be using the 20 and 40 EMAs on BTC/USD trade chart.
Entry Criteria for a Buy Position
The following criteria must be fulfilled before a point can be picked as a good buy position.
Make sure the selected market is going in the uptrend direction.
Add the 20 and 40 EMAs on to the trade chart.
Pay attention to the trade chart so as to know if both the higher high and the higher low of the uptrend line is above the 20 and 40 EMAs.
Patiently wait for the market price to touch the 20 or 40 EMAs lines (i.e this point is the dynamic support). When it does, give the market some time to see how it will react.
If the market react by bouncing off either at the 20 or the 40 EMA line and once again begins to go in the uptrend direction, still wait for it to form two bullish candles above both EMAs, so as to be sure.
After it has formed the bullish candle above the 20 and 40 EMAs, you can then buy at the beginning of the next bullish candle.
Entry Criteria For A Sell Position
The following criteria must be fulfilled before a point can be picked as a good sell position.
Make sure the selected market is going in the downtrend direction.
Add the 20 and 40 EMAs on to the trade chart.
Pay attention to the trade chart so as to know if both the Lower high and the Lower low of the downtrend line is below the 20 and 40 EMAs.
Patiently wait for the market price rise and touch the 20 or 40 EMAs lines (i.e this point is the dynamic resistance). When it does, give the market some time to see how it will react.
If the market react by reject the retraction either at the 20 or the 40 EMA and once again begins to go in the downtrend direction, still wait for it to form two bearish candles below both EMAs, so as to be sure.
After it has formed the bearish candle below the 20 and 40 EMAs, you can then buy at the beginning of the next bearish candle.
There are two conditioned that a trade can be exited: in profit or in loss, as the market can go both ways. In other to avoid losing, it is advisable to set both stop losses and take profit when trading.
Exit Criteria For A Buy Position
A. Exiting buy position in profit
No trader on a normal situation will like to make loss on his trade. Making profit is the goal of every trade. The "take profit" for a buy position should be above both EMAs and the current market price.
The trader can also set his take profit risk to reward ratio to 1:1. The risk to reward ratio of 1:1 implies that if what the trader invested is $250, he aims at gaining $250 in that trade. Therefore, once the trader makes $250,he trade will automatically close and add the traders profit into his portfolio balance.
B. Exiting buy position in loss
Assuming the trade didn't go as planned, the trader should set stoploss price at a price below the market price and below the 40 EMA. This way, if the market suddenly turns in the negative direction, when the market get to the stop loss price, the trade automatically closes, preventing the investor from losing all of his asset.
The trader can also set his "stop loss" risk to reward ratio to 1:1 (maximum). Any risk more than this will affect his trading account badly.
The chart below shows the existing point for our buy position in profit and in loss.
Exit Criteria for a sell position
A. Exiting a sell position in profit
The "take profit" for a sell position should be below both EMAs and the current market price.
The trader can also set his take profit risk to reward ratio to 1:1 (minimum). The risk to reward ratio of 1:1 implies that if what the trader invested is $250, he aims at gaining $250 in that trade. Therefore, once the trader makes a gain of $250, he trade will automatically close and add the traders profit into his portfolio balance.
PS: Check out this article about [How Much Does Coolant Leak Repair Cost?]https://automotiveden.com/coolant-leak-repair-cost/) from Automotive Den
B. Exiting a sell position in loss
Assuming the trade didn't go as planned, the trader should set "stoploss price" at a price above the market price and above the 40 EMA. This way, if the market suddenly turns and starts moving in the opposite direction, when the market get to the stop loss price, the trade automatically closes, preventing the investor from losing all of his asset.
The trader can also set his stop loss risk to reward ratio to 1:1 (maximum). Any risk more than this will affect his trading account badly.
The chart below shows the existing point for our sell position in profit and in loss.
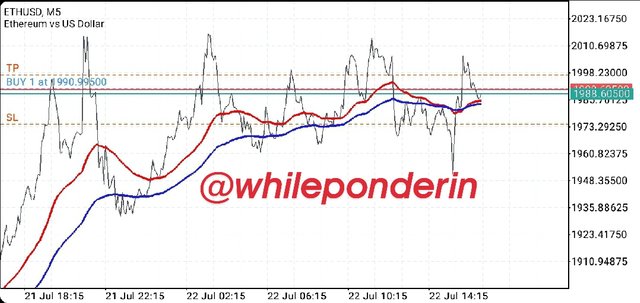
Question 4: PLACE 2 DEMO TRADES ON CRYPTO ASSETS USING DYNAMIC SUPPORT AND RESISTANCE STRATEGY. YOU CAN USE A LOWER TIMEFRAME FOR THESE DEMO TRADES
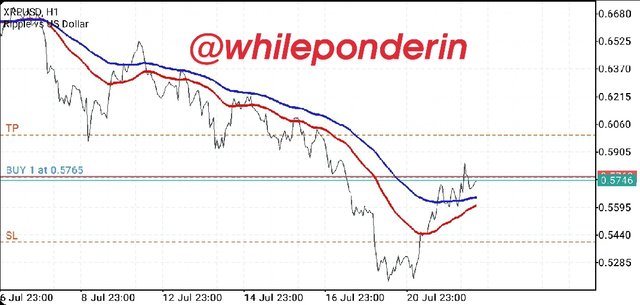
I executed the Demo Trades Using EMA on my Metatrader4 mobile app. I used two EMAs at period of 50 (red) and 100 (blue)
In the chart below, you can see that the market has reversed and is now going on the upwards direction. The price of the asset touched the 50 EMA and bounced off it forming multiple bullish candles.
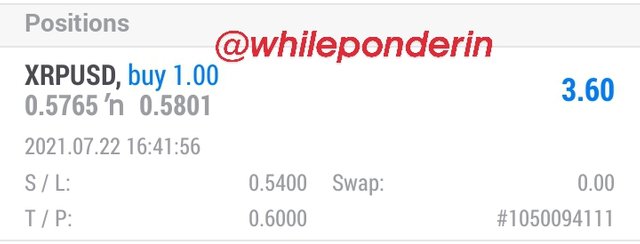
I executed the buy order after the price of the asset moved away from the 50 period EMA. I set the Take Profit Price above the EMAs, and the stop Loss below the EMAs and the market price.
At the end of the trade I made a profit of $3.60.
In the chart below, you can see that the market is going in the upwards direction. The price of the asset touched the 50 EMA and bounced off it forming multiple bullish candles.
I executed the buy order after the price of the asset moved away from the 50 period EMA. I set the Take Profit Price above the EMAs, and the stop Loss below the EMAs and the market price.
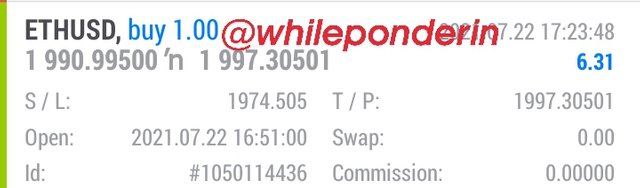
At the end of the trade I made a profit of $6.31. The trade automatically closed when the market price reached the "take profit" I specified. This is shown in the screenshot below.
Dynamic support and resistance strategy is an important trading strategy that every crypto trader should familiarize himself with. Unlike the normal support and resistance trading strategy where people wait for the market to return first to the horizontal support or resistance level first before they begin to trade; through the aid of Exponential Moving Average (EMA), traders can explore several trading opportunities offered by the dynamic support and dynamic resistance levels even while the market is moving in an uptrend or downtrend.
Thank you professor @cryptokraze for teaching this strategy.
PS: Also Read How To Remove Moisture From Car Headlight Without Opening.
Dear @whileponderin
Thank you for participating in Steemit Crypto Academy Season 03 and making efforts to complete the homework task. You got 6.5/10 Grade Points according to the following Scale;
Key Notes:
We appreciate your efforts in Crypto academy and look forward for your next homework tasks.
Regards
@cryptokraze