Crypto Academy / Season 3 / Week 3- Homework Post for Professor @lenonmc21 - Topic: All about Trends, Supports and Resistances and simple chart patterns.
The price of an asset is a reflection of the actions of it's buyers and sellers. If the quantity of the asset the buyers are willing to buy is larger than the amount the sellers are willing to sell at a given time, it causes the price of the asset to increases. If on the other hand, the quantity of the asset the sellers are willing to sell is larger than the amount the buyers are willing to buy at a specific time, it causes the value of the asset to drop.
Due to the fact the actions of buyers and sellers of an asset is not steady, the price of an asset is not steady too. When the prices of an asset at specific intervals are represented on a chart, it creates a wave-like kind of pattern. Sometimes the price continues to rise in the upwards direction (uptrend), or fall in the downward direction (downtrend), other times, the price is fairly steady.

In today's lecture, professor @lenonmc21 while teaching on the topic "All about Trends, Supports and Resistances and simple chart patterns" has explained to us the concept of support, resistance and trend lines, below is my response to the assignment he gave after the class.
Question 1: DEFINE IN YOUR OWN WORDS WHAT IS A "TREND" AND TREND LINES AND WHAT IS THEIR ROLE IN CHARTS?
The word trend is one of the frequently used word in our generation. When people say "following the trend", it means going in the same direction everybody is going. When something is said to be "trending" it means that that it where everyone's interest is in.
Considering the concept of trend in terms of the market, trend shows us the interest of the investors on an asset at every point in time. When investors are willing to invest more in an asset, the price rises, but when they begin to lose interest, the price begins to fall.
In cryptocurrency trade, the price action of an asset is represented in a graph/chart. This graphical representation makes the interpretation of the price action of an asset very easy. Based on the chart, you can know whether the asset is on an UpTrend, DownTrend, or sideways.
These basic movement of the market is refered to as the market trend. Below is a description of each of them.
- Uptrend:
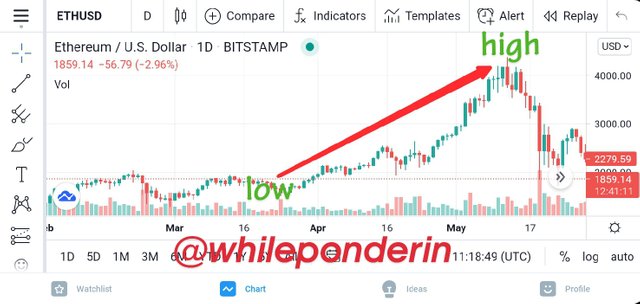
When the price of an asset is on the uptrend, it means that it's going up or rising within that period of time. The uptrend has two notable points: Higher high and Higher low points.
The higher low is the price of the asset in the beginning of the uptrend, while the higher high is the highest price of the asset in an uptrend.
- Downtrend:
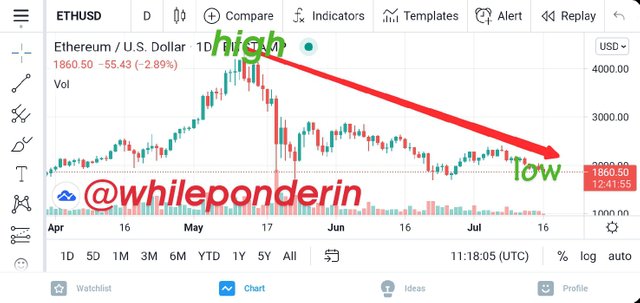
When the price of an asset is on the downtrend, it means that it's going down or decreasing within that specified period of time. The downtrend has two notable points: Lower high and Lower low points.
The Lower high is the price of the asset in the beginning of the downtrend, while the lower low is the lowest price of the asset in a downtrend.
Trend lines are basically diagonal lines drawn in a trade chart from swing points. These lines help to point out areas where the market will be profitable for the trader. It also indicates the general price movement of an asset.
This means that although the market may be showing some retractions, using trend lines, a trader can know the general direction of the market, whether it's in the upward direction or the downward direction. Also, using trend lines, a trader can know when the trend has broken (i.e change in the general market direction).
Basically, we have two types of trend lines, they are the bullish trend line (which is formed during a bullish/upward trend) and the bearish trend line (which is formed during a bearish/downward trend).
Trend lines are very important in technical analysis. They point out to the trader whether to buy or to sell.
Question 2: EXPLAIN HOW TO DRAW AN UPTREND LINE AND DOWNTREND LINE
When plotting a trend lines, you have to pay attention to the following:
- Bullish Trend line.
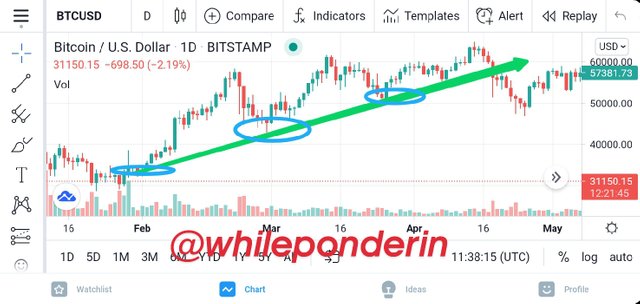
When drawing an bullish trend line, we must make sure that the market is going on the upwards direction. Then, we select a period in the chart we want to study.
Then, we will draw a bullish trendline from the relative low point to the relatively highest point, such that the line connects at least two of the higher low points. This is shown in the screenshot below.
Also Read: How much does a Dyno tune cost? – (Everything to Know) by steadymechanic
Also Read: How To Quiet A Noisy Car AC Compressor? – (Causes & Solutions)
- Bearish Trend line.
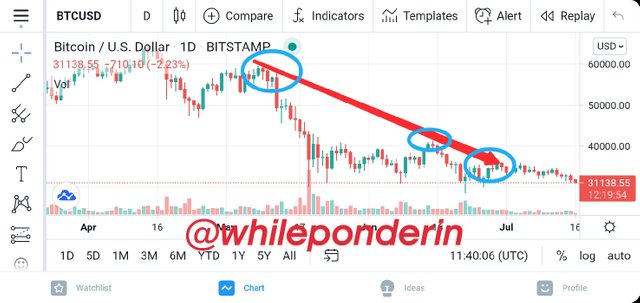
When drawing an bearish trend line, we must make sure that the market is going on the downwards direction. Then, we select a period in the chart we want to study.
Then, we will draw a bearish trendline from the relative high point to the relatively lowest point, such that the line connects at least two of the lower high points. This is shown in the screenshot below.
Question 3: DEFINE IN YOUR OWN WORDS WHAT SUPPORTS AND RESISTANCES ARE AND HOW WE CAN IDENTIFY BOTH ZONES
When carrying out a technical analysis on a trade, one of the most important points to look out for in a chart are the places where the trade forms support and resistance lines. I will be explaining what the support zone and resistance zone are in this question.
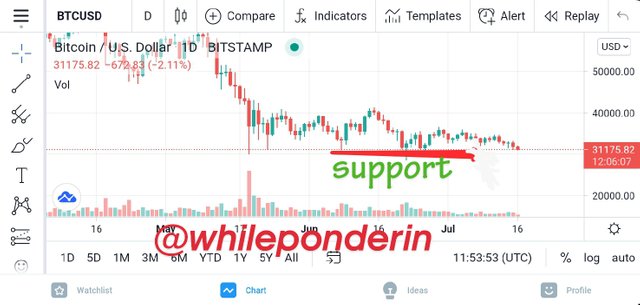
Supports are notable points in a downtrend market. It is the point where the price of an asset that is on a continuous decrease fails to fall below. Support lines are like bench mark in the market, set up by the actions of the buyers and sellers.
Thus, once the price of the asset falls to the support point, instead of continuing in that downtrend, the market reverses and starts moving in the upward direction. This happens because most investors who wish to accumulate a crypto asset will begin to buy at this point. The more they do, the more the asset increases in value and thus the market begins to rise again.
The strength of a support line is totally dependent on how many times the price of the asset got to that point without crossing the line.
It's worth noting that the strength of support zone is dependent on the timeframe it was formed. A support zone formed on a weekly time frame is definitely stronger than one formed on a daily time frame.
Below is a screenshot of a support zone.
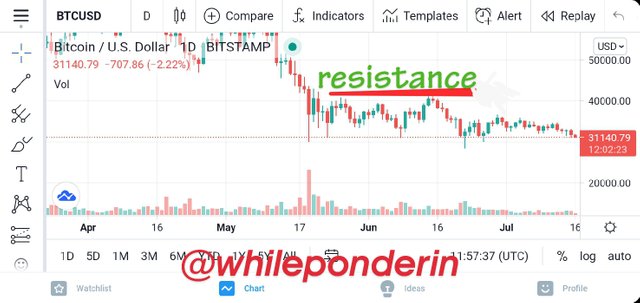
Resistance are notable points in an uptrend market. It is the point where the price of an asset that is on a continuous increase fails to cross over. Resistance lines are like bench mark in the market, set up by the actions of the buyers and sellers.
Thus, once the price of the asset rises to the resistance point, instead of continuing in that uptrend, the market reverses and starts moving in the downward direction. This happens because most investors who have accumulate enough of the crypto asset will begin to sell them at this point. The more they do, the more the value of the asset decreases and thus the market begins to fall again.
The strength of a resistance line is totally dependent on how many times the price of the asset got to that point without crossing the line.
It's worth noting that the strength of resistance zone is dependent on the timeframe it was formed. A resistance zone formed on a weekly time frame is definitely stronger than one formed on a daily timeframe.
Below is a screenshot of a resistance zone.
Question 4: EXPLAIN IN YOUR OWN WORDS AT LEAST 2 SIMPLE CHART PATTERNS WITH SCREENSHOTS.
There are several chart patterns, all of which convey information about the market of an asset. To answer this question, I will be considering only two of them: Double Top pattern and double floor chart pattern.
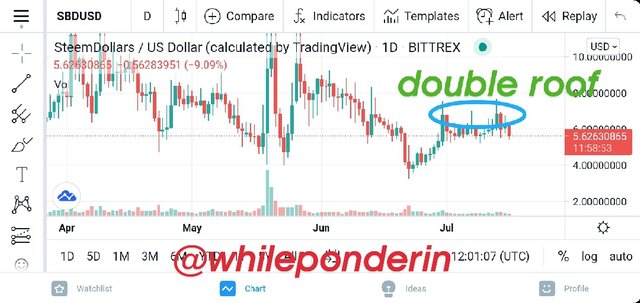
Double top Pattern is formed when the market going in the uptrend direction reaches the resistance zone twice without crossing it. You will find the double top chart pattern at the top of an uptrend.
Note:- For a double top to be formed, there must first be a resistance zone. Then, the trade must revisit the first resistance zone without breaking through it.
Whenever a double top or roof occurs, it's an indication that their is going to be a medium or a long term reversal in the direction of the market (i.e the uptrend market will change to an downtrend market)..
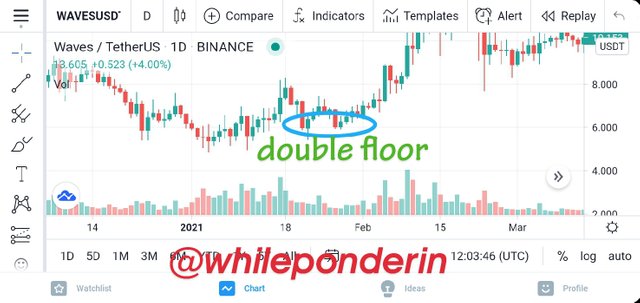
Double floor Pattern is formed when the market going in the downtrend direction reaches the support zone twice without failing below it. You will find the double floor chart pattern at the top of a downtrend.
Note:- For a double floor to be formed, there must first be a support zone. Then, the trade must revisit the first support zone without breaking through it.
Whenever a double floor occurs, it's an indication that there is going to be a medium or a long term reversal in the direction of the market (i.e the downtrend market will change to an uptrend market).
Trend lines, Support and resistance zones are very important in predicting the direction of the market in cryptotrading. Infact, it's hard to make market predictions without making mentions to them.
Thus, it essential that everyone who wishes to engage in crypto trading know what these trading terms stands for, and also what they look like in a trade chart. Having a good knowledge of them will definitely help the trader make good trading decisions.
Thank you professor @lenonmc21 for this amazing lesson, am glad I participated.
Also Read: Service AdvanceTrac Cost: (Meaning, Causes & How to Fix It)