Crypto Academy / Season 3 / Week 2- Homework Post for Professor @yohan2on- Topic:Trading with the Fibonacci Retracement levels.
Nothing about the universe and all that is in it is chaotic. No matter how random and irregular events may seem, a careful study of it will reveal that it actually follows a steady pattern. A mathematician named Leonardo Fibonacci in 1202 discovered that everything in the universe seem to follow a particular sequence. This sequence is what is referred today as the Fibonacci sequence. This sequence starts from 0, 1, 1, 2, 3, 5, 8, 13, 21,... and goes on till infinity, each of the numbers obtained by summing up the two numbers before it.
Fibonacci sequence have been found in most of the unexpected places; for instance the dimensions of the pyramid at Giza, in leaves, and even in the arrangement of planets in the solar system. Since this sequence has been found too often in unrelated places and it's too regular to be just a coincidence, it has now been nicknamed "nature's universal rule." The sequence has been claimed by some to be a scientific proof of God's existence. It may be, who knows.
Since is found in the most random places, and have been found most useful in solving math problems, it's not suprising that this sequence have been employed in solving Cryptocurrencies related problems.
In today's lecture, professor Nick Diaz while teaching on the topic "Trading with the Fibonacci Retracement levels" has shown us how we can make profitable decisions using percentages derived from this sequence. This post is my response to the assignment he gave after the class.
Question A: WHAT ARE FIBONACCI RETRACEMENT LEVELS?
Question B: PRACTICALLY DEMONSTRATE YOUR UNDERSTANDING OF THE FIBONACCI RETRACEMENT LEVELS USING A CRYPTO TRADING CHART OF YOUR CHOICE. (Use trading view)
To understand what Fibonacci retracement levels are, we must first understand what the word "Retracement" means.
Retracement is said to have occured if the market reverses temporary from it's major trend direction. Retracement is common in Uptrend and Downtrend phases of the market. For instance, let say the market is going towards the uptrend direction, then for some reason the market starts to go down, after few days or hours, it starts going in the uptrend direction again, we say that during those few periods it went down, the market was experiencing a retracement. The same thing is applicable if the opposite occured, i.e the market is on the downtrend and for some reasons it start going up, only for it to correct itself and start going down again.
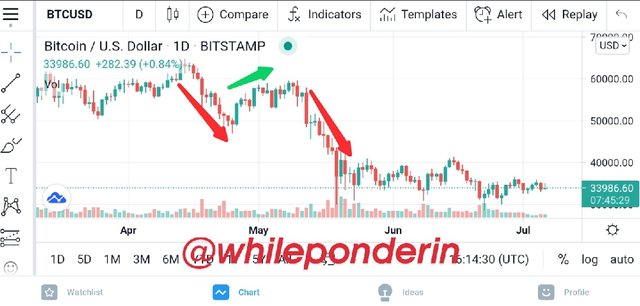
The screenshot below shows a BTC/USD trade undergoing retracement. The general market is on the Downtrend direction, but we saw a small retracement occur within few days in May.
Based on the idea that the market is not random, mathematicians have developed a tool using the Fibonacci sequence which can comfortably predict the point at the Market when a possible retracement can occur. This tool measures the proportion of the market retracement level, and based on that assessment, the trader can predict when the next retracement is likely going to occur so as to decide whether to buy or sell.
Based on the Levels derived using the Fibonacci sequence, there are basically four Retracement Levels. They are at 23.6%, 38.2%, 61.8%, 78.6%. There is also a retracement level at 50% too, but this level wasn't obtained using the Fibonacci sequence. I believe that this level was chosen as it's the balance point of the market.
Most times, the Fibonacci retracement levels do correspond to the Resistance or Support points of the trade, and the trader can exploit this small change in the market in making little more profit for himself before the market corrects itself. Below is a screenshot showing that the retracement levels corresponding with the support and resistance lines.
Note:- Fibonacci retracement levels can only be used on markets going in the Uptrend or in a Downtrend direction. Its level of accuracy is greatly reduced when used in other phases of the market.
The Fibonacci Tool used in crypto trading basically consist of drawn lines and curves. These lines are drawn to cross the market high points and low points obtained in the Fibonacci curve . Before anyone can be able to plot using the Fibonacci Tool, the person must be able to identify when the market trending and when the market experiences a temporary reversal.
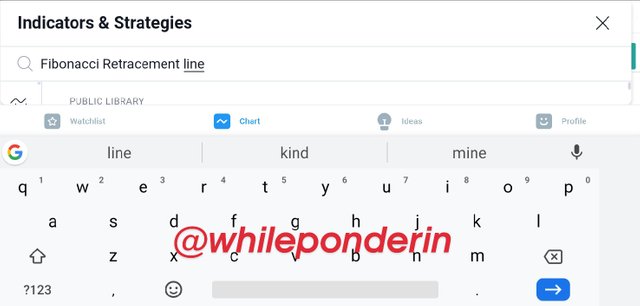
Most trading apps have the Fibonacci retracement tool equiped in them. To add it to trading view. Follow the following steps.
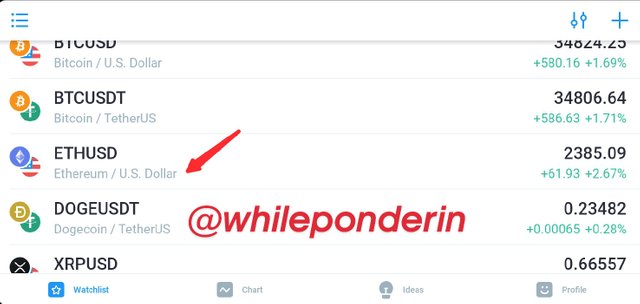
Step 1:- Open the app, and select any trade pair of your choice
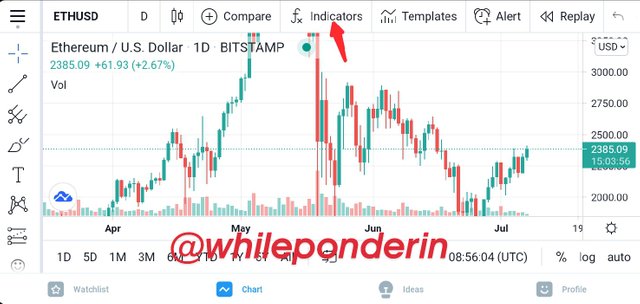
Step 2:- Click on "FX indicators"
Step 3:- Search for Fibonacci retracement line, then click on it.
You will notice that the lines have been added to your chart.
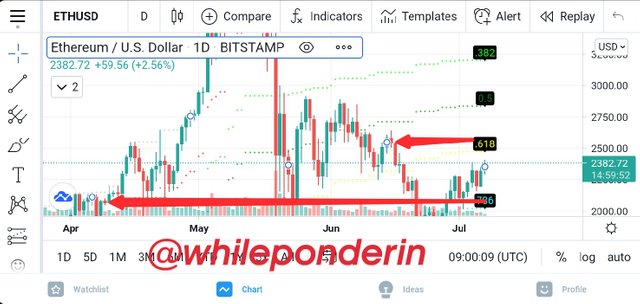
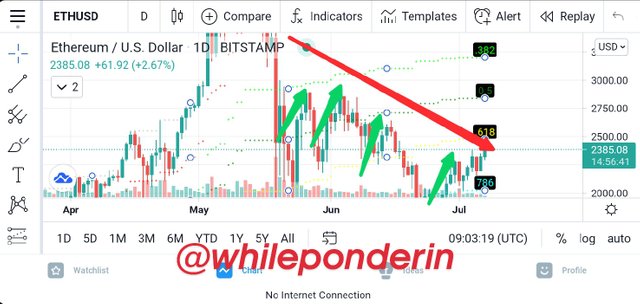
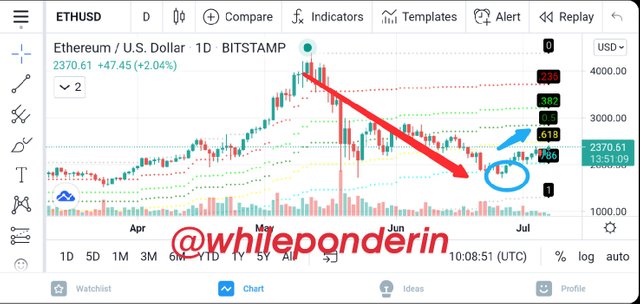
To explain this, I will be considering the ETH/USD chart in the past months. Looking at the chart, you can see that the market have been generally on a Downtrend, but from time to time we saw that the market temporary going in the Uptrend direction (retracement). This is shown in the screenshot below.
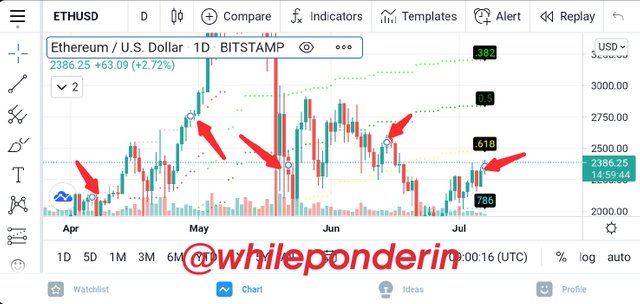
The Fibonacci percentages 23.6%, 38.2%, 61.8%, 78.6% occur at either a support point or a resistance point. The only deviation to this rule is the 50% level, and this was because it was randomly chosen and wasn't obtained using the Fibonacci sequence.
For our case study, the points was plotted at positions that were previously support but now they are resistance. Assuming the chart was in the Uptrend direction, the graph will be plotted in the support position that was previously resistance.
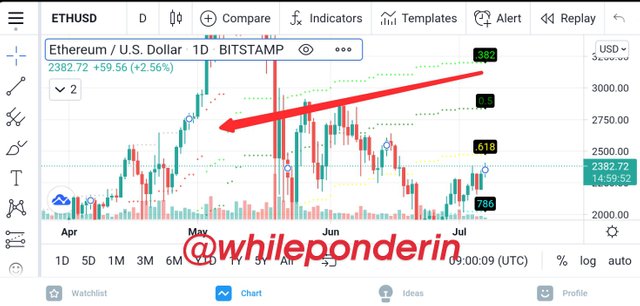
Also notice that each of these point are plotted from a high point to a low point as shown in the screenshot below.
This is because the market is undergoing a down trend. Assuming the market is experiencing an Uptrend, you will notice that the plot will be from a low point to a high point.
- Entry Strategy
The Fibonacci Tool should never be the only reason why a trader should enter a trade, rather it should be used along with other crypto trading indicator tools. This is because the Fibonacci Tool only predicts when a retracement is likely to occur in the market. It doesn't predict how long the retracement will last, therefore it's wise to base your trading decisions on analysis obtained from it in addition to the one obtained from candlestick patterns, support and resistance lines and several other indicators.
Before you enter a trade suggested by Fibonacci Tool, you must make sure that the trade fulfils the following criteria.
The market should either be in an uptrend or in a Downtrend direction.
The current phase of the trade should be in a retracement, that is, if the market is generally on a Downtrend, the market at that point should be in an Uptrend.
Analyze the candlesticks pattern to confirm if the market is really in your favor.
Then plot the Fibonacci lines from low to high (for Uptrend market) and high to low for a (Downtrend market).
In the case study, the chart is a Downtrend, thus from high (A) to low (B), as shown in the screenshot below. Also the best entry level is also shown in the screenshot.
- Existing Strategy
Traders using Fibonacci can set up an exiting strategy by picking out take profit areas and stop loss areas. Setting this two areas up will really go a long way in protecting traders from incurring much loss from a trade. This kind of reduces the risk factor associated with cryptotrading.
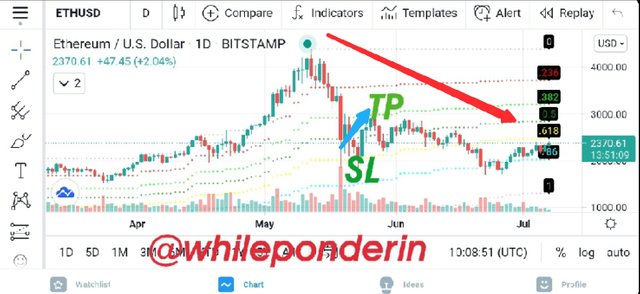
Let me explain how to take profit and and also how to set up Stop loss, using the screenshot below.
1.Setting up Take Profit Exit:
In setting up "Take Profit", the trader chooses a certain price in the positive direction at which once the trade gets to that point, it automatically closes and then adds your gaining to your portfolio. In the screenshot above, the trader could place his Take profit at the point represented by TP.
Normally, trader use the ratio 2:1 in selecting the price to use for the "take profit" and "stop loss". This implies that the "take price" will be two times the price for "stop loss".
2.Setting up Stoploss Exit:
In setting up "Stop loss", the trader chooses a certain price in the negative direction at which once the trade gets to, it closes automatically. Although the trader experiences a loss if the price of the market falls to this level, his loses are reduced. In the screenshot above, the trader could place his Stop Loss at the point represented by SL.
Normally, trader choose the price for "stop loss" to be at 1:2 ratio with the take profit price. Using Fibonacci, a trader can know the areas where he should place these stop losses.
Using the Fibonacci Tool, the trader can select which points where he will take profit and also where he will stop loses. Depending on his analysis using other trading indicators, he can set the Stop loss pip at about 5 to 10 pips above the level of Fibonacci from where the trade started.
Also, to avoid making any loss at all from the trade, he can select the stop loss price to be in the profit. This strategy is called Trailing Stoploss.
The Fibonacci Tool is best used along with other indicators tools, as Fibonacci can only measure retracement levels in the market.
The major trading indicators that can be used along side the Fibonacci Tool include candlesticks patterns, dynamic support and resistance lines and so on. With these tools, the trader will be able to make better market decisions, and realize more profit for himself.
The cryptocurrencies market and cryptotrading is very risky but filled with high rewards, therefore it's extremely important that every one who want to make profits from cryptocurrency trading ensures that he equips himself with enough tools. The more equiped you are, the lesser the losses you experience, and likewise the greater your profit.
The Fibonacci Tool is quite an essential trading tool, it helps a trader make profits regardless of it the trade is in the Uptrend or in the Downtrend. This implies that you don't necessarily need the price of a cryptocurrencies to be high before you can make profit, instead with this tool, the market will remain profitable to you as long as it's going in the upwards or in the downward direction.
Thank you professor @yohan2on for this amazing lesson. I learnt a lot from it.

Hi @whileponderin
Thanks for participating in the Steemit Crypto Academy
Feedback
You plotted your Fibonacci wrongly on that chart. When you are looking for a retracement in a downtrend, the Fibonacci ought to plotted by dragging from the top to the bottom. The 0 level had to be down that downtrend but instead, I have seen it at the top of the downtrend in your chart.
Where you placed you placed your TP and SL. Unless, you are doing contrarian trading, which is a very risky way of trading. In a downtrend, you are always basically looking for good sell entries. You, therefore, had to place your SL up and your TP somewhere down that trend.
Your chosen Fibonacci tool was also not a very visible one. I wish you looked around on Trading view for the one I used. Take a look at mine below;
Check out the position of the 0 level in that downtrend. That was the right positioning of the Fibonacci tool.
You need to study more on how to apply the Fibonacci retracement levels in trading. Your article lacked a correct practical approach to the usage of the Fibonacci retracement levels in trading.
Homework task
4
Thanks Professor @yohan2on. I will do better next time. Have a great day sir.