Support and Resistance Breakouts - Crypto Academy / S6W3 - Homework Post for @pelon53

Hello and welcome to week 3 of crypto academy season 6. I will be doing the homework posts on Support and Resistance Breakouts explained by professor @pelon53. As a crypto trading novice, I was quite attracted to the topic thinking it's easy but it's very technical. I have read and understand the class to the best of my abilities, hope the readers can learn something from my post. Without any further Ado, let's begin with the homework.

1.- Explain in detail the advantages of locating support and resistance on a chart before trading.
The law of demand states that more of a good is demanded at low prices and the law of supply says more of a good is supplied and higher prices. Support and resistance in charts are not lines, they are zones because traders cannot determine these areas accurately.

Resistance zones appear when the market has been on a buy for quite some time due to low prices but at a certain level, prices increase and sell interests set in causing the market to take a downtrend.
Support zones are zones where a downtrend has paused then an uptrend starts. This means traders are now buying due to and increase in prices.
To be able to analyze this zones in a clearer perspective, traders use indicators like moving averages, RSI indicator and volume indicator. Each of these indicators have a unique way of helping traders analyse market trends when it comes to support and resistance zones.
Locating support and resistance zones on a chart advantageous to a trader because of the following reasons;
The first advantage I noticed is that it helps traders to determine price action in the market. For a support zone, this where a downtrend pauses because there is a concentration of buys at that point due to decrease in prices.
Support and resistance are advantageous because they can be used to predict the next trend in the market. When a trend reaches th resistance zone, it is mostly expected to pause and take a new trend towards the support zone.
Traders use support and resistance zones to determine thier entry and exit points in the market. For example since it is expected that when a downtrend reaches a support zone, it is expected to take a reverse towards the resistance zone. When this happens, traders will input their take profit at top of the support zone and the stop loss at the bottom of support zone.
Hence the trend reversal occurs from the support zone towards the resistance zone, profits will be made.A situation can occur where a trend violates the resistance and support zones. In case of a violation, with a close stop loss huge losses can be avoided.
2.- Explain in your own words the breakout of support and resistance, show screenshots for the breakout of a resistance, use another indicator as a filter.
A resistance breakout is when a trend moves passed the resistance zone probably due to high volume of the asset or coin is being overbought. Resistance breakouts could act as a sign for traders to initiate long or short tem buy orders Breakouts could initiate losses for some traders who already placed their stop losses above the resistance line hoping for a trend reversal. Hence losses will be incurred if the trend continues in the breakout direction. Below I am going to use a screenshot from my trading view app to demonstrate a resistance breakout using the RSI indicator.

In th chart above, I used the GBPUSD pair and a timeframe of 1D. The indicator I used for this chart analysis is the RSI indicator because this indicator has a maximum point which is 70 and a minimum point which is 30. The a trend over the point 70 indicated that and asset has been overbought and a trend that continues below 30 shows that the asset had been oversold. In such cases, a pullback or correction is expected to happen. Also, the maximum and minimum points can also serve as resistance and support zones respectively.
From the chart presented above, the resistance and support zones have been shown clearly. The trend experienced a breakout in resistance. We can see on the indicator that the breakout tested the resistance zone 2 times before it fell back into trend with a bullish action.
Also from the indicator we can see that the breakout was almost at the point 80 which is above the maximum point (overbought) so a trend reversal will be normal expected by traders.
In another case, the breakout would have continued into a new trend. The point which retested the resistance zone would have been the new support zone and a new resistance would have been formed.
3.- Show and explain support breakout, use additional indicator as filter, show screenshots.
Support breakouts are when price moves below the support zone due to an high volumes or the assets are being oversold. At support breakouts, traders can also place short term sells if they predicted the breakout won't trend for long or long term term sells if they are certain that the breakout will continue into a new trend.
A screenshot is provided below to illustrate a support breakout.

For the support breakout illustration I used the BTCUSDT pair and a 1D timeframe. The support zone had been highlighted on the charts and a breakout can be seen both on the chart and on the RSI indicator. The breakout was sharp and it moved back into trend then tested the support zone and broke out again before finally taking and upward trend.
For traders who set their take profits above the support line, profits were made even though they incurred small losses. From my analysis, traders who made longterm sells at the breakout made losses. Looking from the point of the indicator, the breakout was below the minimum point so there was an expected trend reversal.
4.- Explain what a false breakout is and how to avoid trading at that time. Show screenshots.
A false breakout is a phenomenon where price moves passed the support and resistance zones then retreats back into the original expected direction of the trend. Since resistance and support levels are not very accurate, indicators are highly needed to determine such situations. Traders who are impatient might close their trades at such points and accept losses. Below are screenshots of support and resistance false breakouts to help throw more light on the explanation.

I used AUDUSD 1D for the chart above. There was a false breakout at the resistance zone. The trend went passed the resistance zone for a very short while then dived into a trend reversal towards the support zone. Like I said above impatient traders will stop their trade at that point and accept losses while patient traders willing to take the risk will make some profit at the end.

I used AUDUSD pair and a timeframe of 1D to demonstrate the false support breakout. It was a very short breakout which later bounced back into the expected trend direction.
It is not easy to analyze if a breakout is false or not. But with the help of indicators and sticks, this can be made possible. To avoid looses at this point, you can use the volume indicator. Read breakouts showcase high volume action on the volume indicators. So when there is a breakout with no spike in volume, then that breakout can been seen to be a false breakout.
For the candlesticks, the trader should wait for the next two candlesticks to form. If the form in the direction of the breakout then it's real, if not then false.
As seen in the screenshots above, for the false resistance breakout, we can see that the next candles are bearish candles meaning the breakout was false. For the false support breakout we can observe the same thing. The next candles wear bullish candles so the breakout was false.
Nevertheless trading during a breakout is risky so the trader need to analyze very well before inputting a trade or they should be patient and observe the trend action for a while longer.
5.- On a demo account, execute a trade when there is a resistance breakout, do your analysis. Screenshots are required.
For my resistance breakout, I used the ETHUSD pair and a timeframe of 1H. Based on my analysis I initiated a sell order at the resistance breakout.

From my chart analysis as shown above there was a breakout in the resistance zone. Using my indicator the breakout was above the maximum point which is 70 so I expected a trend reversal. Looking at the candles, a bearish candle was forming so I expected that the trend continues back into the zone.

From those analysis I did, I initiated a sell order hoping a downtrend will begin towards the resistance zone. I put my take profit below and my stop loss above with 0.1 lot size.

I took the screenshot above 1 hour after I placed the sell order. The trade made small profits along the line but at the end it ended with losses. Showing that the breakout continued into a new trend.
6.- In a demo account, execute a trade when there is a support break, do your analysis. Screenshots are required.
For my support breakout trade, I used USDHUF pair and a 1H timeframe with a lot size of 0.1. I initiated a buy order as I expected a trend reversal after the breakout.

The trend comes and nearly retests the the support zone so I analyzed that it is and indicator of a trend reversal accompanied with the fact that a bullish stick was forming.

I placed my take profit above and my stop loss below. Hoping my analysis was correct, I then placed a buy order.
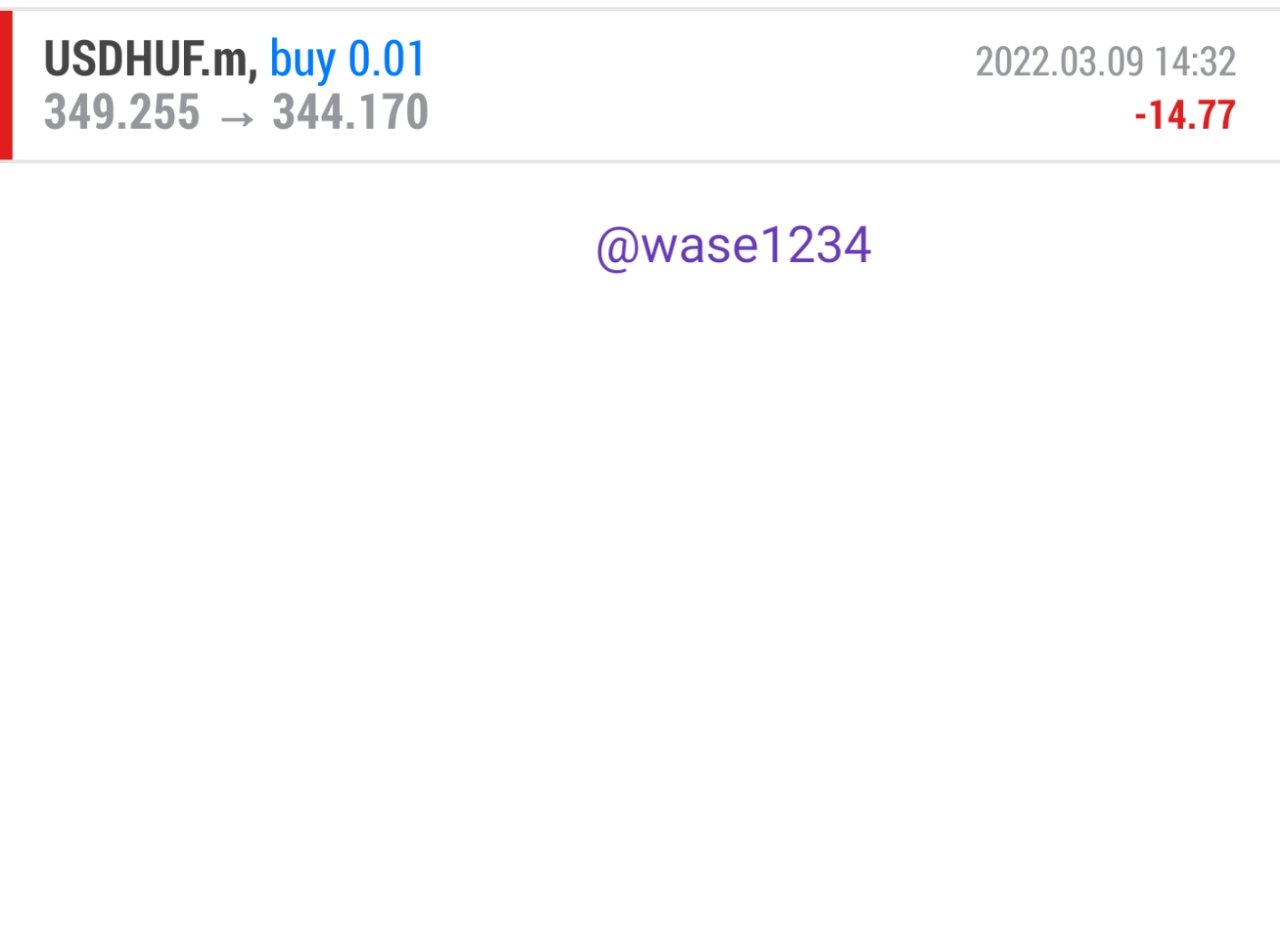
This screenshot was taken 1 hour after the trade was made. My analysis was wrong and the breakout continued in the bullish direction till my my stop loss was hit and the trade stopped.
I have explained to understanding what support and resistance zones are and I have given a visual example of it as well as the advantages of this zones.
I did some research on indicators, and I chose to use the RSI indicator for all my charts because it seems more accurate to me. I am also aquatinted with volume indicators when it comes to breakouts. Here, volumes ard high when a breakout is and there is the change or action in volumes when the breakouts are false.
For the buy and sell order I put, I did not get profits. From what I can say it was due to lack of patience and probably hasty decisions in my analysis.
Overall I really enjoyed doing this assignment because it helped me know things I didn't know and I was able to place my first ever trade using support and resistance breakouts. Due to my lack of knowledge in trading, I had to do extensive research and it was quite a challenge for me. Nevertheless the topic was a good one.
Thanks to professor @pelon53 for dishing out such and amazing lesson.
Upvoted! Thank you for supporting witness @jswit.

I invite Sir @pelon53 to please grade my post