Steemit Crypto Academy Season 4 Beginner's Course - Task 10: Candlestick Patterns

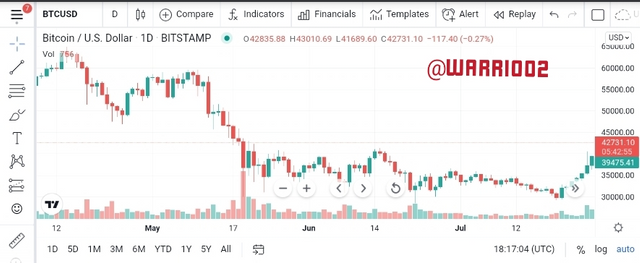
1a) Explain the Japanese candlestick chart? (Original screenshot required).
(b) In your own words, explain why the Japanese Candlestick chart is the most used in the financial market.
(c) Describe a bullish and a bearish candle. Also, explain its anatomy. (Original screenshot required)
(a)Explain the Japanese candlestick chart? (Original screenshot required).
source
Japanese candlesticks are a technical analysis tool that traders make use of to follow and study the change in stock prices. The notion of the candlestick chart was introduced by a man called Munehisa Homma, who was also a Japanese rice trader.
Candlestick graphically show the movement in price with the use of various colors to Indicate the contrast.
Traders now use candlestick to recognize price patterns and make up their mind based on short term trend of prices. The Candlestick chart is a famous technical indicator for analyzing financial markets by traders.
The Japanese Candlesticks give extra comprehensive and precised statistics on the movement of prices and also give a graphical depiction of demand and supply.
With demand been more than supply, prices tends to be high due to much buying. Causing the market to be in a bullish state(upwards) which is shown with a green candlestick.
Whereby supply suppresses demand, this will lead to a fall in price(downward) due to much selling. And this is shown with a red candle.
(b) In your own words, explain why the Japanese Candlestick chart is the most used in the financial market.
Candlestick chart makes Patterns easy to recognize and understand, if a little attempt is made to analyze them.
They give more details with regard to the connection between buyers and sellers in a particular timeframe. The bearish and bullish engulfing patterns can give many details on market sentiment.
A trader can recognize if the market is bullish or bearish, with looking at the colours and the lengths of the candles. Such information may not be obtainable in some other charts.
Candlesticks can recognize market turning points and as well trend directions.
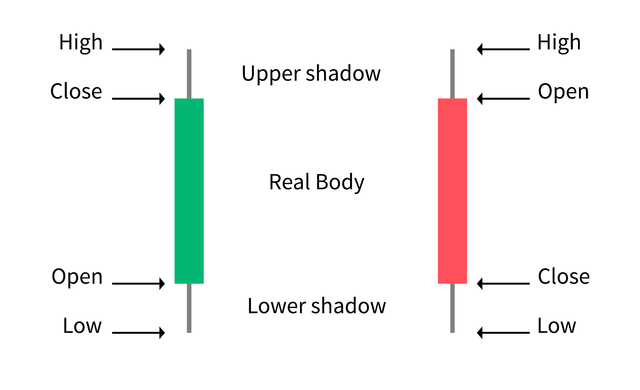
(c) Describe a bullish and a bearish candle. Also, explain its anatomy. (Original screenshot required)
source
Bullish candle
source
The bullish candlestick pattern lets the traders know that the market is going to go in for an uptrend after a preceding drop in prices. This reversal pattern indicates that the buyers are in charge of the market and the price could even push up more.
Anatomy of the bullish candle
Open: This is the beginning of the candle. It is likewise referred to as the opening price. It shows where the price movement starts, and a bullish candle constantly opens lower.
Low: This is the minimal price that was attained all through the time period. The bullish candlestick, the low may be beneath the open or equal price like the open.
Close: The close spots where the Candlestick ends, after a duration of time. It is likewise called the closing price. A bullish candlestick continually closes better than it opened due to buying force.
High: Maximum price attained in a given time period. Its high may be above the close or same with the close, which tells that there has been buying pressure which has pushed prices above the open.
Bearish candle
source
A bearish candle Indicates that there are more sellers in the market than buyers, making the prices to fall. This is according to the rule of supply and demand. It could be said that the market is selling off or weakening.
Anatomy of the bearish candle
Open: This is the beginning of the candle. It is likewise referred to as the opening price. It shows where the price movement starts, and a bearish candle constantly opens higher.
High: Maximum price attained in a given time period. Its high may be above the open or same with the open, which tells that there has been buying pressure which has pushed prices above the open.
Close: The close spots where the Candlestick ends, after a duration of time. It is likewise called the closing price. A bearish candlestick continually closes lower than opened due to buying force.
Low: This is the minimal price that was attained all through the time period. The bearish candlestick, the low may be beneath the close or equal price like the close.
Conclusion
Candlestick analysis is a famous and productive way to study charts, for beginners as well as expert traders.
If one can locate reversal, indecision or confirmation patterns and recognize whether a trend is over or just decelerating downwards. Then, one can come up with a good trading choices with extra accurate entry and exit plan of action.
Cc:
Professor @reminiscence01