Crypto Trading With Williams %R Indicator - Crypto Academy / S4W4 - Homework Post for @kouba01
Hey Guys..!!
Meet again with me Wahyu Nahrul on the other Steemit Crypto Academy homework. Today I will be working on homework given by one of our professors @kouba01.
The homework given by our professor this week is about Crypto Trading With Williams %R Indicator.
Okay, just get to the discussion. Happy Reading !!

Williams %R Indicator
The Williams %R indicator is an indicator that was first introduced by a well-known trader and writer named Larry R. Williams, He introduced this indicator in 1972 in a book he wrote himself entitled "How I Made One Million Dollars… Last Year… Trading Commodities".
This indicator is an indicator that has an oscillator type and this indicator also looks almost exactly the same as other oscillator indicators, namely the Relative Strength Index (RSI) indicator. Just like the RSI indicator, the Williams %R indicator is also an indicator that can display the condition of a market whether it is in Overbought or Oversold conditions which can provide a momentum signal for traders and investors to start trading in a market.
However, unlike the RSI indicator which has a market movement range from 0 to 100, the Williams %R indicator has a slightly different movement range, the range used is from -100 to 0. Then the Williams %R indicator also has upper and lower limits that are called Upper Band and Lower Band, where the Upper Band is at the number -20 while the Lower Band is the line at the number -80. If the Williams %R oscillator line touches the Upper Band, it indicates that the market is overbought. On the other hand, if the oscillator line touches the Lower Band, the market is oversold.

1. How to calculate Williams %R Indicator
The formula for the Williams %R Indicator is as follows:
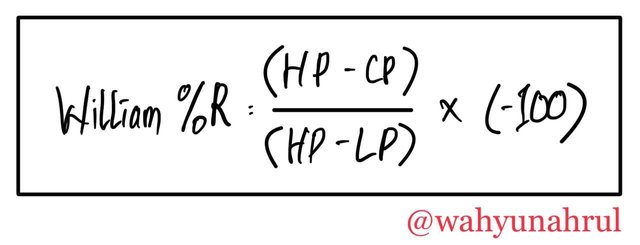
Where:
- HP: Highest Price in a period
- LP: Lowest Price in a period
- CP: Current Price
To find out how the Williams %R indicator works, I will take an example from the SOL/USD chart with a 1-day timeframe that looks like the picture below.

In the chart above I have included the Williams %R Indicator on the SOL/USD chart with a 1-day timeframe with a length setting of 14 which means that the Williams %R indicator will refer to the price on the last 14 days or the last candlestick. And based on the chart above we get price movement data from the last 14 days as follows:
- Highest price for the last 14 days (HP): $173.79
- Lowest price for last 14 days (LP): $115.45
- Current price (CP): $143.21
And based on the Williams %R Indicator formula shown earlier, we can calculate the current value of the Williams %R Indicator. The calculation is as follows:
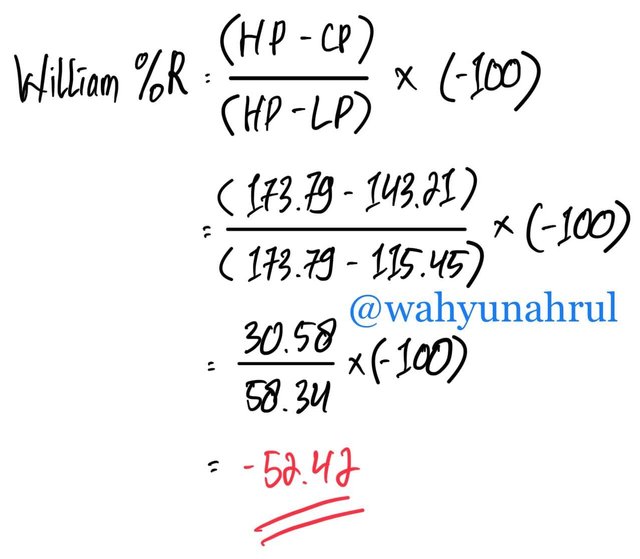
From the calculations that I have made above, I get the value of the Williams %R Indicator of -52.42 and there is only a slight difference when compared to the value of the Williams %R Indicator directly from the SOL/USD chart shown that the value of the Williams %R Indicator is amounting to -52.41.
Based on the value of the Williams %R indicator, we can conclude that the current market conditions are not in a good momentum to start trading because there are no overbought or oversold signals given by the Williams %R indicator.

2. Best settings for Williams %R Indicator
When we enter the Williams %R indicator on the chart, it will automatically use length 14 by default. This is because length 14 is the length most often used by technical indicator makers and Larry R. Williams who is the inventor of the Williams %R indicator also uses length 14 as the default length for the indicator he makes.
According to experts, length 14 is the most appropriate length to use for each indicator, this is because using length 14 will take data from the previous 14 candlesticks and will make the accuracy level of the signal given by the indicator better, and at the same time will reduce the false signals given by indicators.
For example, if we open a cryptocurrency chart using a 1-day timeframe and we will use the Williams %R indicator as our trading tool, the movement of the Williams %R indicator will adapt to the price movement of the cryptocurrency for 14 days or 2 weeks backward so that the value presented by the Williams %R indicator is a summary of a lot of data and the value given by the indicator can be more accurate.
But even though length 14 is the default length used in the Williams %R indicator, it doesn't mean it's the most perfect setting.
In my opinion, the best arrangement is to look at our respective trading styles because everyone must have a different trading style, someone maybe prefers with short-term trading type and another one more prefers to long-term trading type.
For the short-term type, the best setting is to use a shorter indicator length, this will make the Williams %R indicator more sensitive to price changes, although it should be noted that it will cause various false signals as well. As for the long-term type, it would be better to use a longer indicator length such as 20 or 30, thus the value shown by the Williams %R indicator will be more stable and will only change drastically if there is a very sharp price change in the market.

Interpret Overbought and Oversold Signals With The Williams %R
As I discussed in the previous discussion, the Williams %R indicator is an indicator that is able to provide overbought and oversold signals in a cryptocurrency market. But behind this, there is an interesting thing to understand, namely if the Williams %R indicator gives false one such signal, it is highly likely that trend reversal will occur in the market.
1. Overbought Signal (Trend reversal from Bullish to Bearish)
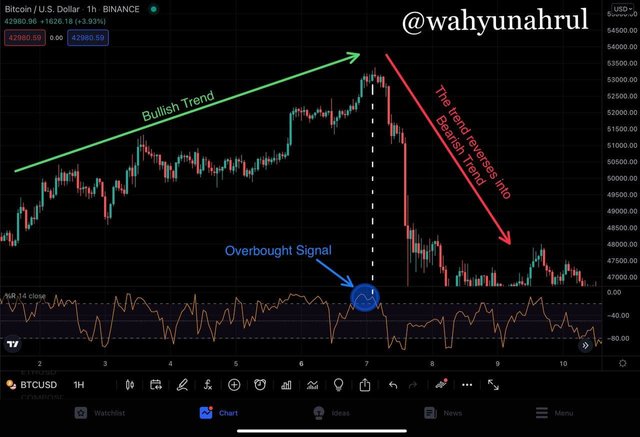
An overbought signal is a signal where the oscillator line on the Williams %R indicator touches or crosses the Upper Band line which is at the -20 level. At a time like this, market conditions are overbought or which means the number of buyers has begun to decrease and is accompanied by an increase in the number of sellers.
When this happens, the large bullish trend that occurs in the market will end and turn into a bearish trend. For example, we can see in the BTC/USD chart above, previously Bitcoin was experiencing a long bullish trend phase, then after a while, the Bitcoin price started to sideways for a while and the Williams %R indicator also showed that the BTC/USD market condition was overbought. Then after a while, the bullish trend turned to bearish and the price of Bitcoin began to experience a very deep decline.
At times like this, it is the right time for traders to take profit from the crypto-assets they have, or to enter short selling if they are doing two-way trades.

2. Oversold Signal (Trend reversal from Bearish to Bullish)
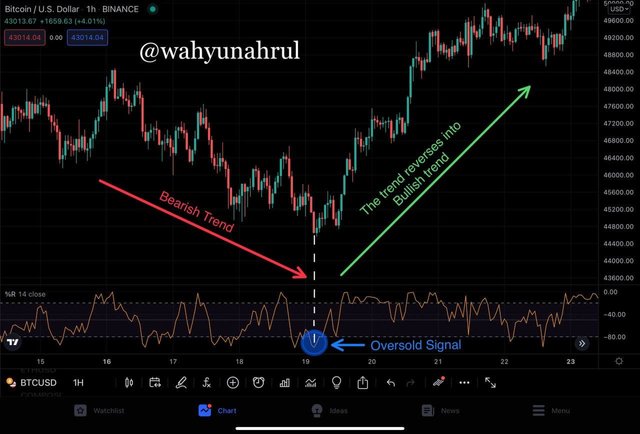
The oversold signal is a signal that is most often awaited by spot traders and investors, this is because the oversold signal is a signal that tells that the price of a cryptocurrency is at its lowest level so it would be great to make large purchases.
An oversold signal will occur if the oscillator line on the Williams %R indicator touches or crosses the Lower Band line which is at the -80 level. At a time like this, market conditions are oversold, which means the number of sellers has begun to decrease and is accompanied by an increase in the number of sellers.
For example, we can see in the BTC/USD chart above, previously Bitcoin was experiencing a fairly deep bearish trend phase and a few moments later the Bitcoin price began to experience sideways for a while and the Williams %R indicator also showed that the BTC/USD market condition was oversold. Then after a while, the bearish trend turned to bullish and the price of Bitcoin began to experience a significant increase.

Failure Swing
The Williams %R indicator has an oscillator line that will continue to move up and down following the trading movement of a cryptocurrency and as I explained earlier if it touches one of the Band lines there will be a signal indicating a trend reversal. But that doesn't always happen, there is a moment where the oscillator line doesn't manage to touch one of the band lines and starts experiencing a trend reversal, this moment is called "Failure Swing".
The trend reversal that occurs in the failure swing is a phenomenon where the dominance of a trend in the market is classified as weak and immediately turns into another trend. Usually failure swings occur on relatively short timeframes, so the failure swing moments are often used by short-term traders or scalping traders because they can get profits relatively quickly.
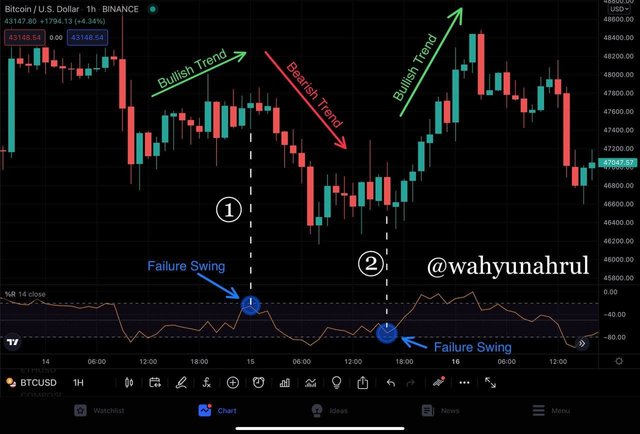
To make it clearer, I will explain it with an example chart that I have put above. We can see that at moment number 1, the Bitcoin price is on the rise and the Williams %R indicator also started to creep up so it almost touched the Upper Band line, but before it managed to touch the Upper Band, the Williams %R indicator oscillator line began to decline and was accompanied by a decline. the price of Bitcoin so that the trend that was initially Bullish turned into Bearish.
Then shortly after, the current bearish trend in the Bitcoin market turned back into a bullish trend. This can be seen in moment number 2 where the Williams %R indicator oscillator which is heading towards the Lower Band suddenly changes its direction to the top. This happens because there is resistance from the market where the number of people buying dominates more than people selling, so even though the oscillator has not touched the Lower Band and the overbought signal has not occurred, the Bitcoin price has started to rise and the trend has changed in a very short time and this is what which is called Failure Swing.

Using Bearish and Bullish Divergence With The Williams %R indicator
Based on my explanation in previous discussions, we can see that the movement of the Williams %R indicator will be in line with the movement of the market trend. But this is not always the case, at some time there is a difference in movement between the Williams %R indicator and the price movement/trend of a cryptocurrency, this difference is called "Trend Divergence".
Divergence Trend is a situation where there is a dissipation between the movement of the oscillator line of the Williams %R indicator and the actual price movement, this is a rather rare thing because basically the movement of the Williams %R indicator takes data from the movement price from the market. Just like the Failure Swing that we discussed earlier, trend divergence is a signal that indicates a trend reversal that traders and investors can use to start entering a market. Based on the type, divergence is divided into 2 types which are Bullish Divergence and Bearish Divergence.
1. Bullish Divergence
Bullish Divergence is a moment where the candlestick on the chart shows that the price in the market is experiencing a decline or is experiencing a bearish trend but the Williams %R indicator is increasing. This indicates that the dominance of sellers in the market is starting to weaken and the direction of the trend will turn into a bullish trend.
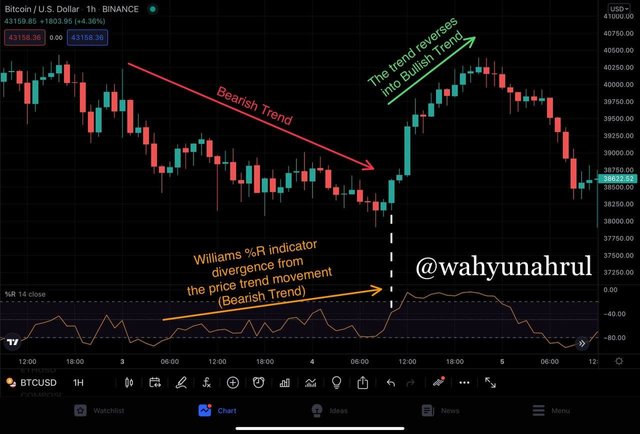
In the chart above, we can see that initially Bitcoin was experiencing a bearish trend while the movement of the oscillator line from the Williams %R indicator increased towards the Upper Band, indicating that the Williams %R indicator signaled a bullish divergence and there would be a trend reversal. Then after a while, the trend which was originally bearish turned into bullish.

2. Bearish Divergence
Unlike the Bullish Divergence, the Bearish Divergence is a moment where the candlestick on the chart shows that the price in the market is increasing or experiencing a bullish trend, but the Williams %R indicator has decreased. This indicates that the dominance of buyers in the market is starting to weaken and the direction of the trend will turn into a bearish trend.
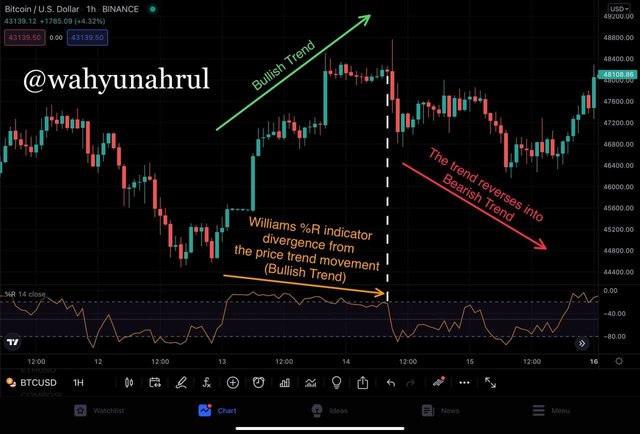
For example, in the chart above, we can see that initially Bitcoin was experiencing a sharp bullish trend, but the movement of the oscillator line from the Williams %R indicator experienced different things from the price movement, the Williams %R indicator showed a decline towards the Lower Band which indicates that The Williams %R indicator signals a bearish divergence and a trend reversal in the near future. This can be used by traders to start taking profit because it is likely that the trend will soon reverse to bearish. And as expected, the trend reversed to bearish after the Williams %R indicator started to move away from the Upper Band line.

Spot Trends Using Williams %R and Filter Out False Signals
As usual, I always tell you that there is no single indicator that can provide certainty to us that we will always get profit from the trades we make, because each indicator has its own advantages and disadvantages.
This is also included in the Williams %R Indicator, although this indicator has the use of being able to provide momentum signals to traders, it is not uncommon for the Williams %R indicator to give false signals that trap traders.
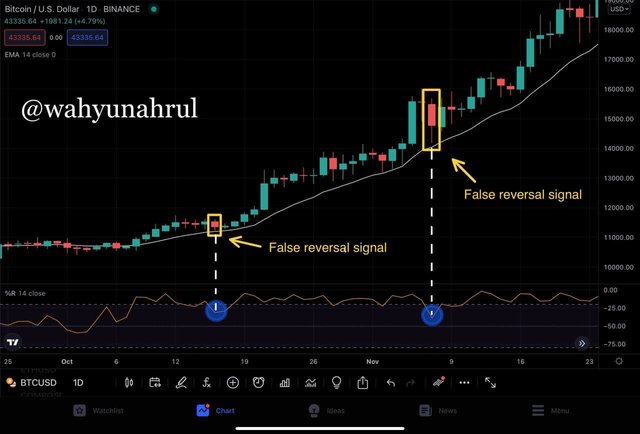
For more details, I will immediately show an example in the graph above. On the chart we can see that the Williams %R indicator has given overbought signals twice which indicates that there will be a trend reversal from bullish to bearish. But the trend reversal didn't really happen, even the Bitcoin price continued to increase significantly.
From this we can see that the Williams %R indicator is not always able to provide accurate signals, there will be times when it gives false signals and does not match expectations. To reduce these false signals, there are many things we can do, one of which is to combine the Williams %R indicator with other indicators such as the Exponential Moving Average (EMA) indicator.
The Exponential Moving Average (EMA) indicator is one of the modifications of the Moving Average (MA) indicator which is often problematic because it often experiences delays in presenting the average price movement of a market. This indicator is one of the most popular indicators among traders because it is proven to be able to provide confirmation in entering trades with very good accuracy.
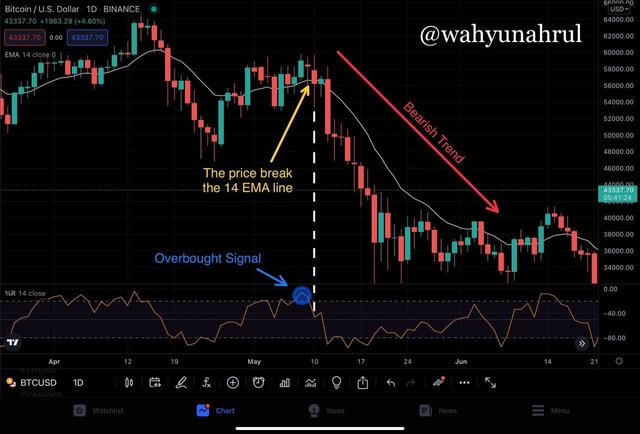
In the example above I have entered 2 different indicators, namely the Williams %R indicator and the Exponential Moving Average (EMA) with the same length of 14. Initially the Williams %R indicator gave a signal that the market was overbought, but the candlestick was still above the 14 EMA line. which means the overbought signal given by the Williams %R indicator cannot be confirmed.
Then after a while, the candlestick began to decline until it crossed the 14 EMA line, this made the 14 EMA line confirm the trend reversal signal given by the Williams %R indicator and after that the trend turned into a bearish trend.
From these two examples, we can conclude that the EMA indicator is very effective at filtering out false signals given by the Williams %R indicator and this indicator can be used as a confirmation indicator to start trading in a cryptocurrency market.

Using Various Signals From The Williams %R Indicator For Trading
Now I will show you how to use the Williams %R indicator in cryptocurrency trading. The crypto market that I take as an example this time is ADA/USD with a timeframe of 4 hours. In this example I will also use the Exponential Moving Average (EMA) indicator as a trade confirmation, the length I use for these two indicators is 14 which means the movement of these two indicators is based on the price movement of the Cardano coin over the last 56 hours.
I will give 2 different examples, namely an example of a buy signal when conditions are oversold and another example of a sell signal when conditions are overbought.
1. Buy Signal (Oversold Condition)
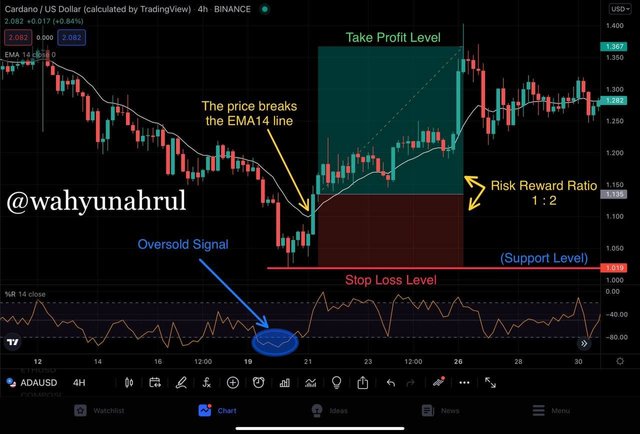
The Cardano chart shows that the market condition at that time was experiencing a bearish trend. Then the Williams %R indicator gives a signal that market conditions at that time are oversold which indicates that seller dominance has begun to decrease and this is a buy signal. At that time the price of Cardano touched its lowest point at the price of $1.019 which will be used as a support level.
After that, the Cardano price slowly started to increase until there was a long candlestick that broke the 14 EMA line which means the EMA indicator has confirmed the reversal signal given by the Williams %R indicator earlier. After that, you can start trading on the next candlestick just in case the price suddenly drops again.
After that, we can adjust the risk/reward ratio according to each risk management. Here I give an example by using a risk/reward ratio of 1:2. The Stop Loss level that we enter is equal to or slightly below the support level that we have previously set, namely at the price of $1.019 while the take profit level is at a price 2 times higher than the support level at the price of $1.367.

2. Sell Signal (Overbought Condition)
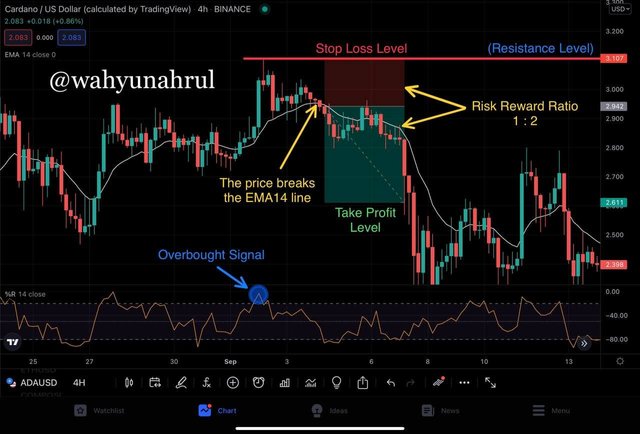
In the chart above we can see that Cardano is experiencing a bullish trend. Then the Williams %R indicator gives a signal that market conditions at that time are overbought which indicates that buyer dominance has begun to decrease and this is a sell signal. At that time the price of Cardano touched its highest point at the price of $3.107 which will be used as a resistance level.
After that, the Cardano price slowly started to decline until there was a candlestick that broke the 14 EMA line which means the EMA indicator has confirmed the reversal signal given by the Williams %R indicator earlier.
For traders who use spot trading, they can already sell their crypto assets when the EMA14 line has confirmed the trend reversal in order to get the best price for take profit. This is because the price of Cardano will most likely continue to decline and if you don't immediately take profit then you will not be able to get the best price to sell your Cardano assets.
As for two-way trading, we can start trading on candlesticks after the candlesticks break through the 14 EMA line, this is just in case the price suddenly rises again.
After that, we can adjust the risk/reward ratio according to each risk management. Here I return to using the risk/reward ratio of 1:2. The Stop Loss level entered must be equal to or slightly above the resistance level that has been previously set at the price of $3.107 while the take profit level is at a price 2 times cheaper than the resistance level at the price of $2.661.

Last Word (Conclusion)
The Williams %R indicator is an indicator that has many benefits for traders and investors, this indicator is able to buy a momentum signal that traders can use to start trading in a cryptocurrency market. Then this indicator also has a simple appearance and is similar to other indicators which makes it easy for traders to use this indicator as a tool for trading.
Even so, we still have to think broadly by combining this indicator with other indicators so that the signals given by the Williams %R indicator can be more accurate, one indicator that can be used as a companion to this indicator is the Exponential Moving Average (EMA) indicator.
Those are some of my explanations regarding Crypto Trading With Williams %R Indicator, I apologize if there are still many mistakes that you can get when reading my explanation earlier, I would be very grateful if you told me in the comments column below.
Thank you for reading my blog, hope it will be useful for all of you. 😁


Hi
Thanks for participating in the Steemit Crypto Academy
Feedback
This is excellent work. Thanks for taking the time in demonstrating such a clear understanding of trading with the William %R indicator.
Total| 10/10
Thank you prof.