[Crypto Trading With Rate Of Change (ROC) Indicator] - Crypto Academy / S4W8 - Homework Post for @kouba01
Hey Guys..!!
Meet again with me Wahyu Nahrul on the other Steemit Crypto Academy homework. Today I will be working on homework given by one of our professors @kouba01.
The homework given by our professor this week is about Crypto Trading With Rate Of Change (ROC) Indicator
Okay, just get to the discussion. Happy Reading !!

Rate Of Change (ROC) Indicator
Price changes are a natural thing to happen to a cryptocurrency asset, each type of cryptocurrency will experience price changes following market demand and the amount of supply in circulation. Each price change is usually shown in percentage size from one period in the past to the current period, this is made so that everyone knows how much the price change occurred in a cryptocurrency with a clear measure. One indicator that can show the percentage change in the price of a cryptocurrency within a certain period is "Rate of Change (ROC)".
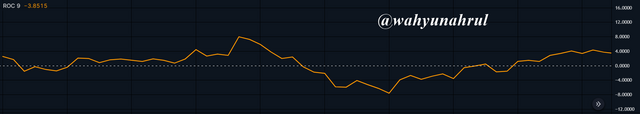
Rate of Change Indicator or more commonly known as ROC is a technical indicator of the type of momentum oscillator that will show the percentage change in the price of a cryptocurrency from the previous period to the current period. Knowing the percentage change in price will help traders to see the movement of the trend direction, trend strength, or trend reversal signals.
This indicator is presented with a line that will move past the middle line which is worth 0%. If the ROC line moves above the 0% line, then there is an indication of a price increase and a bullish trend at that time, and the value shown by the ROC indicator will be positive. Meanwhile, if the ROC line moves past the 0% line towards the bottom, then there is an indication of a decline in price, and the trend will become bearish, and the value shown by the ROC indicator will be negative.
In addition, the ROC Indicator can also show traders Overbought and Oversold momentum conditions, this momentum is usually used by traders to start entering trades so that they can enter into trading a cryptocurrency at the most ideal price. To get this, we will use two helplines which will be the upper level and the lower level so that it will become the limiter, for more details I will explain later in the next discussion. Then, we can also get other moments such as Crossover and Divergence which can be used as trend reversal signals given by the ROC Indicator.

Calculating Rate Of Change (ROC) Indicator Value
After we know what the ROC Indicator is, now we must understand where the value displayed by the indicator comes from. To calculate the value of the ROC Indicator, we will use the following formula:
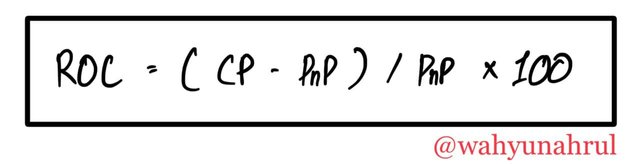
Where:
- CP: Current Price.
- PnP: Price of N Periods Back.
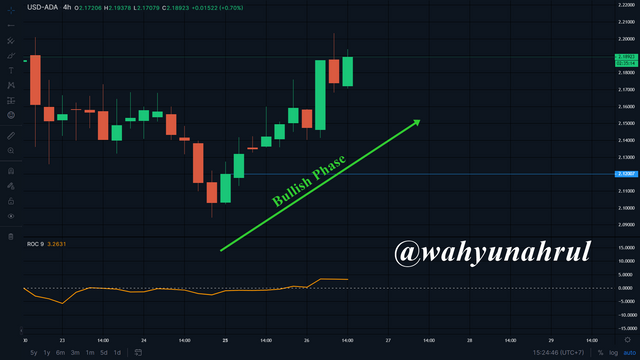
In this example calculation, I will try to calculate the value of the movement of the ROC Indicator with a length of 9, which means we will calculate the percentage movement of a cryptocurrency for the last 9 periods. So that this calculation can be proven directly, I will take the data for the formula directly from a graph, the graph I chose this time is USD-ADA which comes from the Bittrex website which you can see in the image below.
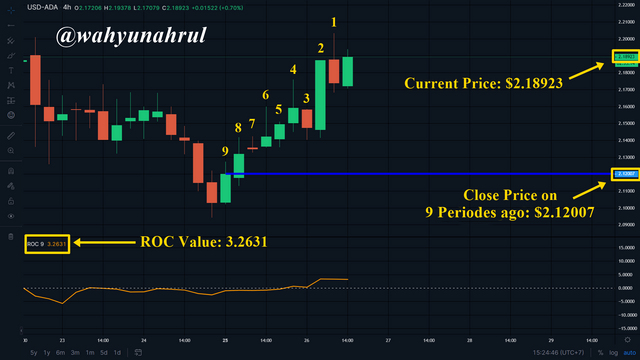
Based on the graphic above, we get some data, including:
- CP: $2.18923.
- PnP: $2.12007.
The ROC indicator on the chart shows the ROC value at 3.2631%. Now we will prove that the result of the calculation of the formula given at the beginning will be the same as the value given to the ROC indicator.
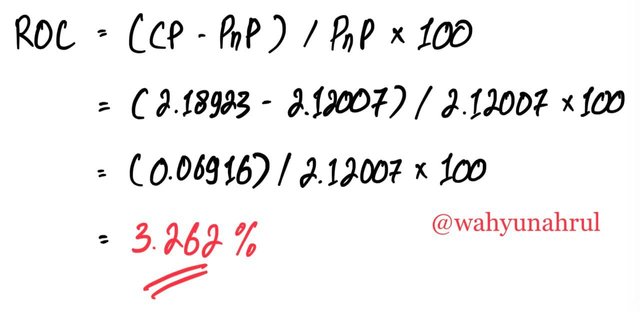
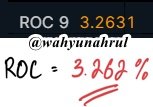
As you can see, the calculation results that I get are based on the data from the chart, and using the formula I mentioned earlier is the same as the value shown by the ROC Indicator in the chart. This proves that the formula and data are correct.
The results of these calculations show that the Cardano coin has increased by 3.262% from the previous price 9 days ago. This indicates that Cardano is starting to increase in price and it is in a Bullish Phase.
Adding Rate Of Change (ROC) Indicator to Charts on Bittrex
Now I will show you how to install the ROC indicator on a cryptocurrency chart. As usual, since professor @kouba01 asked us to take an example from the other platform than TradingView, this time I will show you how to insert the ROC indicator on the Bittrex website.
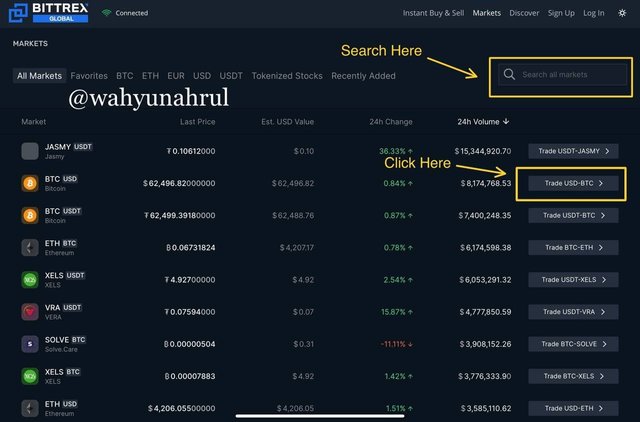
First, we have to visit the Bittrex website, then we will see the start page of the Bittrex website which will look like in the image below.
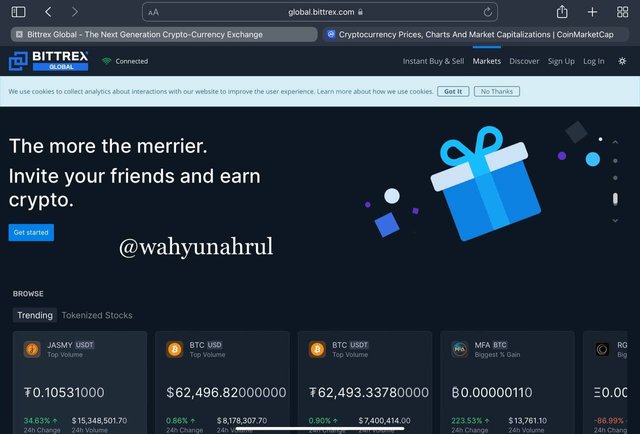
After that, we scroll down the page until we find the "MARKETS" menu. After that we can search for the market pair we want in the search column at the top. But this time I want to take the USD-BT C market as an example. To take it, all we have to do is click on the "Trade USD-BTC" button on the right as shown in the box in the image below.
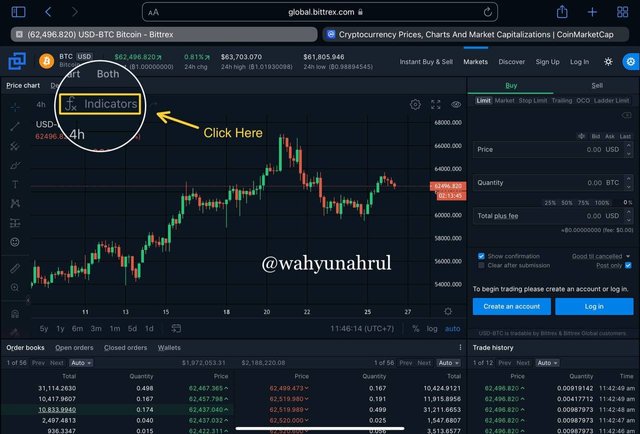
After that, we will be taken to another page that contains graphics, order books, etc. We select the option "Indicators" at the top of the chart of USD-BTC.
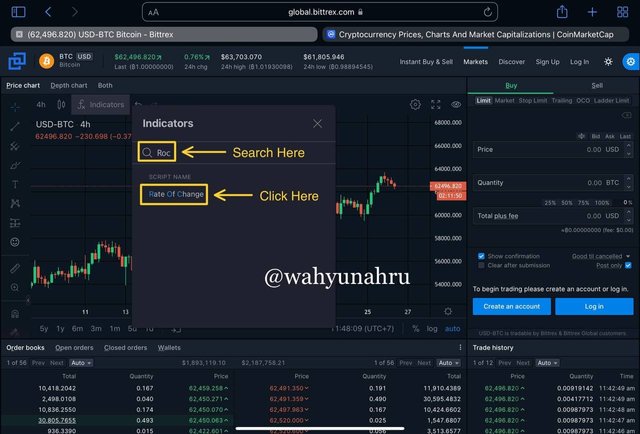
After that, look for the ROC indicator in the search column, then the choice of the indicator will appear, where there is only one choice.
After that, we will enlarge the view of the graph to make it easier to see, we select the 4 arrow icon on the top right of the graph.
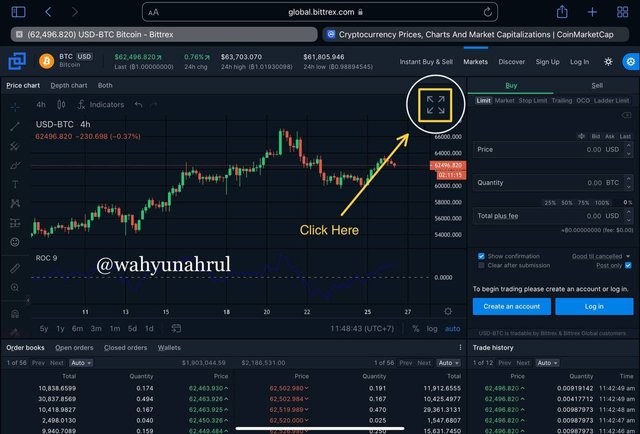
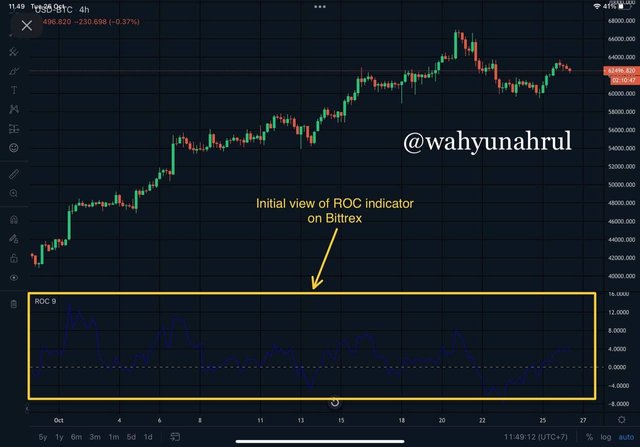
And we can see that the ROC indicator has been successfully added to the USD-BTC chart.
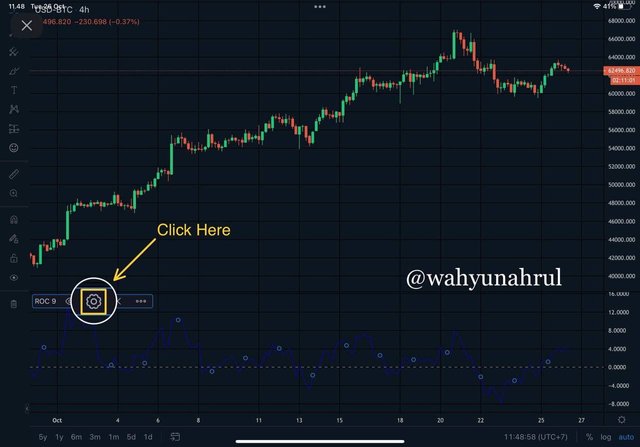
Configuring ROC Indicator Settings
To change the default settings of the ROC indicator to suit our needs, we can change it through the settings of the indicator. The trick is to click on the settings button which is denoted by Gear Icon.
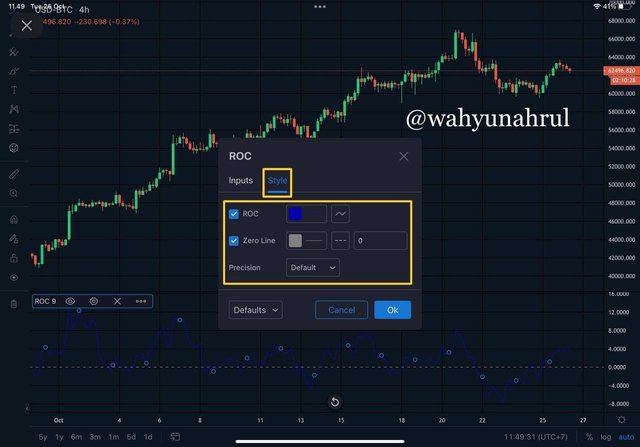
The first thing we can change is the appearance of the ROC indicator. We can change it through the Style menu where we can change the color, thickness, and line type of the ROC indicator.
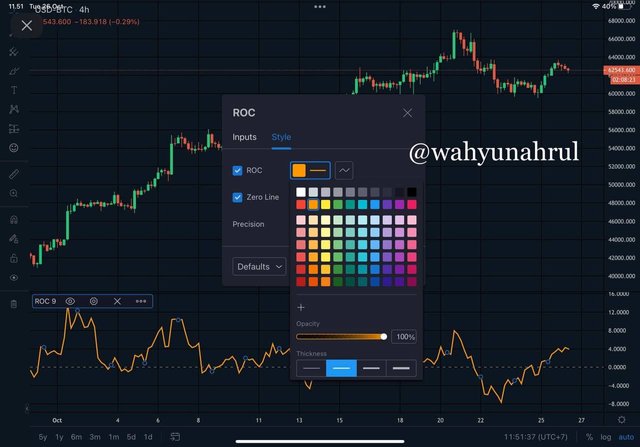
Because the graphic display on Bittrex is dark in color, and the default color of the ROC indicator is a dark blue color that blends with the background, I want to change the color of the ROC indicator line to be lighter and thicker to make it easier to see. Here I chose to use orange color and changed the line thickness to level 2 to make it thicker.
Next, we can change the length setting of the ROC indicator line as we want on the "Inputs" menu. The meaning of length here is how long the period for which the ROC indicator data will be taken will be used as a reference that will move the line of the ROC indicator.
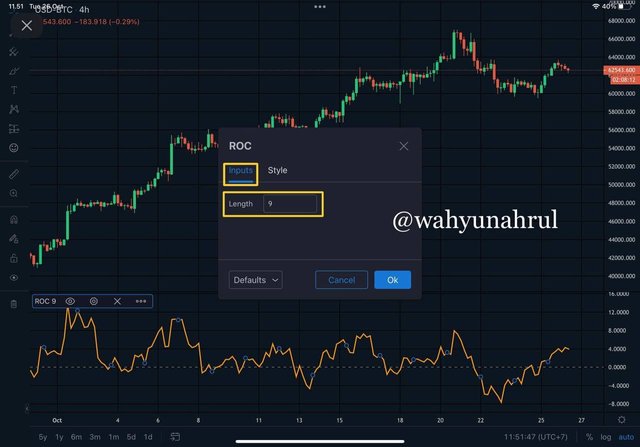
As I explained earlier, the ROC indicator is an indicator that shows the movement of market trends based on the prices contained in the market in a certain period. By default, the ROC indicator will use a length of 9 which means it will retrieve data by looking at price movements in the previous 9 periods.
As we can see that the default setting of the length of the ROC indicator is 9, but it is not a setting that we must use if we want to use this indicator. The best setting that we can use is to first look at the trading style and the type of asset we will be trading.
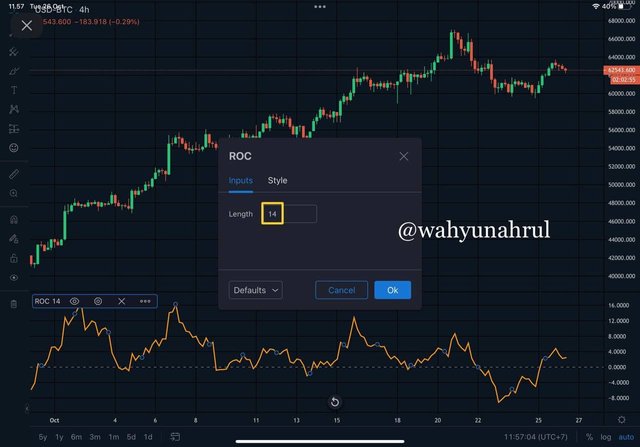
If we are the type of person who trades short distances and the asset we are trading in crypto, then the length we can use will be shorter, this is because the cryptocurrencies market is more volatile than other commodity markets so a shorter length will make the indicator more sensitive to changes in high prices in a faster time. But if we are a medium and long-range type, it would be advisable to use an indicator length that is more like 12 to 25, this can reduce false signals that can be created because the cryptocurrency market is a market that is quite prone to movements in the short term.
I personally often use a period length of 14, this is because in my opinion the period is a period between 12 and 25, and by using a length of 14 and we look at the chart using a 1-day timeframe, the data that will be shown by the ROC chart is a presentation of price movements during the last 2 weeks where it will be safer.
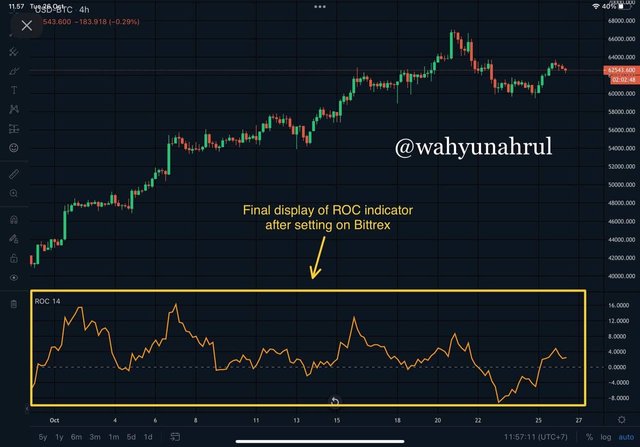
After we finish changing the ROC indicator settings to our liking, then we press OK and the ROC indicator display will change according to our wishes.
Trend Direction Confirmation and Trend Reversal Detection Signals
Trends are very important for a market, especially in the cryptocurrency market. When trading in the cryptocurrency market we are always advised to follow the direction of the trend that is happening in the cryptocurrency market and never try to fight the trend if you don't want to feel a loss. Each indicator has a role to be a means of confirming the direction of the trend, and the ROC indicator can play a role as well.
1. Trend Direction Confirmation
As I explained earlier, the ROC indicator is an indicator that shows price changes using a line that will intersect with the middle line at the 0% level. When this cut occurs, we can use it as a confirmation of the direction of the current trend.
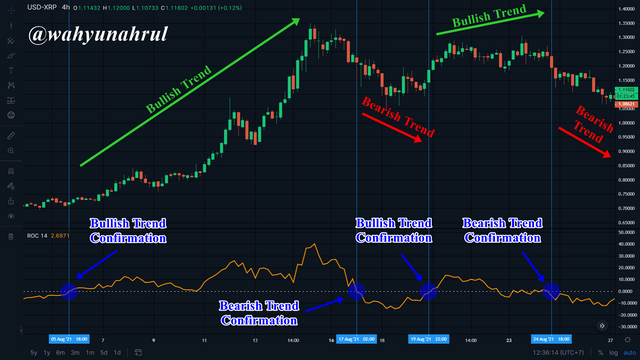
For example, we can see in the chart above where the ROC indicator line intersects with the center line several times. In the first example, we see the ROC line starts to move up and crosses with the middle line this indicates a movement in the direction of the trend to become Bullish, and we can see after that the price movement of XRP really increased and XRP entered the Bullish Trend.
Then after that, the XRP price began to decline so that there was an indication of a trend reversal, and the ROC indicator line started moving downwards until it finally crossed with the middle line again which confirmed the indication of a trend reversal from Bullish to Bearish.
This keeps happening several times so that in the picture the ROC indicator confirms 4 times the trend direction of the XRP coin and all these signals actually occur.
2. Trend Reversal Detection Signal
In addition to being a confirmation of the ten directions, the moment where the ROC indicator line intersects the centerline can also be used as confirmation of a trend reversal, this is called "Crossover". For example, let's look at the following 2 examples.
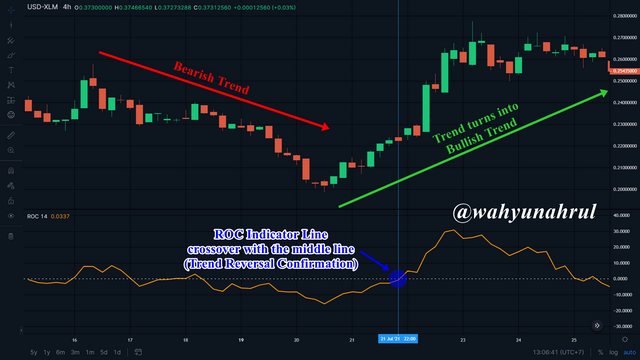
In the first example in the picture above I took the chart USD-XLM with a timeframe of 4 hours. We can see that initially, XLM was in a bearish trend so that the price of XLM experienced a deep decline. Then a few moments later the XLM price increased which indicated a trend reversal from XLM.
Then the ROC indicator also began to confirm this by showing that the ROC indicator line began to increase until it finally crossed with the middle line at the 0% level, this indicates that the ROC indicator has confirmed a trend reversal from Bearish to Bullish in the USD-XLM market, and indeed after that, the trend in the USD-XLM market has turned into bullish.
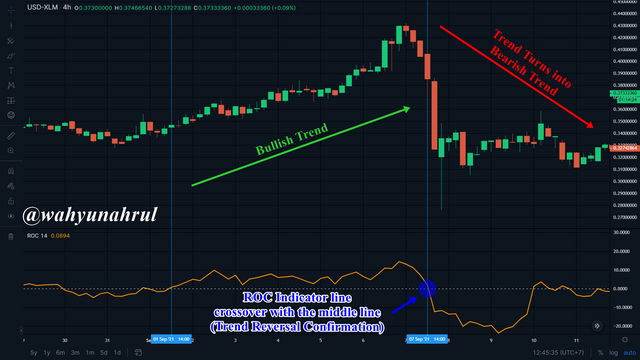
The next example is a trend reversal signal from Bullish to Bearish by the ROC indicator. Here I take the USD-XLM chart with the same timeframe, which is 4 hours.
We can see that initially XLM is in a bullish trend and the ROC indicator line is also above the midline. Then a few moments later the price of XLM experienced a sharp decline and indicated a trend reversal from XLM.
Then the ROC indicator also began to show the ROC indicator line began to decline until finally, it crossed with the middle line at the 0% level, this indicates that the ROC indicator has confirmed a trend reversal from Bullish to Bearish in the USD-XLM market, and after that, the trend is there the USD-XLM market has turned bullish.
This is an example of a signal from the ROC Indicator detecting a trend reversal occurring in the market. Actually, there are several other signals that the ROC indicator can give, namely Overbought and Oversold Zones and another one is Trend Divergence, these two things can both detect trend reversals well. But I will explain these two things in more detail in the next discussion, so please read to the end.
Identification of Overbought and Oversold Signals as well as the Role of the ROC Indicator in Determining Buy and Sell
When using the ROC indicator, we can add 2 additional lines to the ROC indicator which will serve as the upper and lower limits. The limit that can be used is between +/- 3% to +/- 4%. But in my example, I will use a limit at the +/- 4% level.
These two limits will be used as area benchmarks for Overbought Zone and Oversold Zone. If the ROC indicator line crosses the upper limit, then there is an indication that the price of the cryptocurrency is overpriced and has entered the overbought zone. Conversely, if the ROC indicator line crosses the lower limit, then there is an indication that the price of the cryptocurrency is too cheap and has entered the oversold zone.
The right way to use these 2 guidelines is to make decisions when there are 2 conditions in the market, these conditions are:
If the ROC line has entered the Oversold Zone and is starting to cross the lower limit towards the top, then it is a good time to place Buy Order.
If the ROC line is in the Overbought Zone and starts to move and crosses the upper limit towards the bottom, then it is a good time to place Sell Order.
Knowing these two things will help us in making decisions to enter or exit a trade with the right momentum of the market trend.
.png)
The first example can be seen in the USD-DOGE chart above. We can see that at that time the ROC indicator was in the oversold zone which indicated that the DOGE price was too cheap, and after a while, the ROC indicator started to rise and crossed with the lower limit at the -4% level, this shows an indication of an increase. the price of DOGE in the near future, so when the ROC indicator crosses the lower limit we will place a Buy order.
.png)
Then in another example with a USD-DOGE chart as well, we see that at that time the ROC indicator was in the overbought zone, which means buyers have dominated the market and the DOGE price is too expensive. Then after a while, the ROC indicator starts to decline and finally crosses with the upper limit, this shows that there is an indication that the DOGE price will decline in the near future. So when the ROC indicator crosses with the upper limit, we will sell the DOGE that we already have, or we will enter a trade by placing a short position if we are trading both ways.
Trading With Divergence Between ROC and Price Movement
As we already know that Trend Divergence is a very rare thing for an oscillator-type indicator because these indicators always see price movements as data that will be displayed on the indicator, so most of the direction of movement of the oscillator-type indicator will follow from the direction of the oscillator-type indicator. price movement. So the Divergence Trend is often referred to as a rare momentum that can be used as a benchmark to signal a trend reversal.
Likewise, for the ROC Indicator, there are several moments where the ROC indicator moves against the direction of the price movement on the chart, those moments are Bearish Divergence and Bullish Divergence.
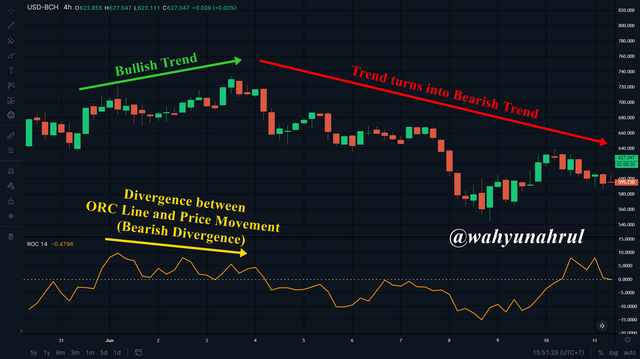
1. Bearish Divergence
Bearish Divergence is a moment where the direction of the trend at that time is in a Bullish trend but the line on the ROC indicator moves in the opposite direction towards the bottom.
.png)
This indicates that the market at that time was undergoing a transition from being a dominant buyer to being a dominant seller. This happens because market conditions have entered the Saturated Buy phase where many people have started to take profit.
For example, we can see in the USD-BCH chart image above where initially the BCH price movement was increasing, which means BCH is in the Bullish Trend phase. But the ROC indicator actually shows the opposite where the ROC indicator line begins to move downwards towards line 0, and after the ROC line crosses the middle line of the trend, the USD-BCH market has reversed from a bullish trend to a bearish trend.
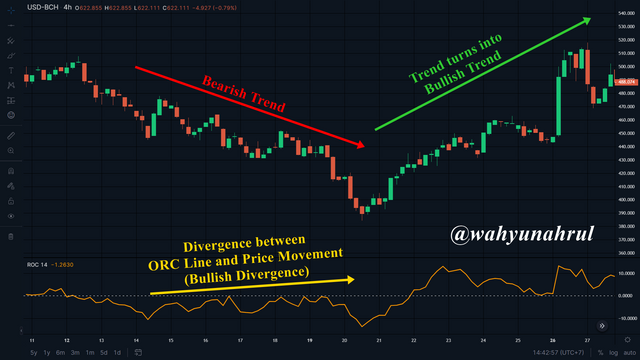
2. Bullish Divergence
Bullish Divergence is a moment where the direction of the trend at that time is in a Bearish trend but the line on the ROC indicator moves in the opposite direction towards the top.
.png)
This indicates that the market at that time was undergoing a transition from being dominant to sellers to being dominant to buyers. This happens because market conditions have entered the Oversold phase where many people have started making purchases.
For example, we can see in the USD-BCH chart image above where initially the BCH price movement was experiencing a decline, which means BCH is in the Bearish Trend phase. But the ROC indicator actually shows the opposite where the ROC indicator line begins to move up towards the 0 lines. And after a while, the trend in the USD-BCH market has reversed from a Bearish Trend to a Bullish Trend.
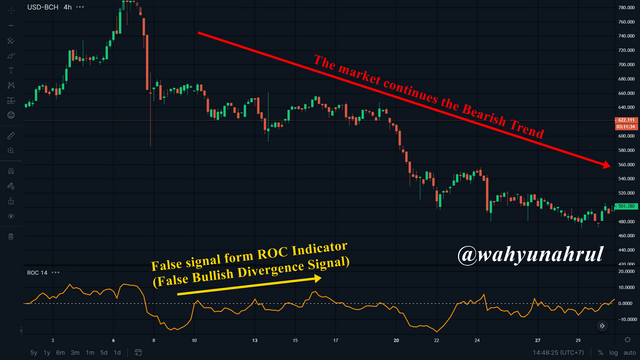
3. False Signals of Trend Divergence
Even though we already understand very well what Trend Divergence is happening on the ROC indicator, it does not rule out the possibility of momentum becoming a boomerang for traders because this could be a false signal where there is no trend reversal at all in the market.
.png)
For example, we can see in the USD-BCH chart above that the trend is undergoing a long bearish phase and there is a signal from the ROC indicator regarding a bullish divergence momentum which initially indicated that there would be a trend reversal from bearish to bullish in the USD-BCH market. . But what we can see is that no trend reversal occurred and BCH price continued to decline and continued its Bearish Trend.
This can be a real example of not always fixating on a momentum that we consider a rare momentum that will definitely match our expectations. To reduce these errors, we can use other technical indicators in order to get more accurate signal confirmations so we don't have to rush into making decisions in trading.
Identify and Confirm Breakouts Using ROC Indicator
Breakout is a momentum where there is a sudden significant price change that breaks through a predetermined resistance or support level. Usually, this momentum occurs where at first the market is in a sideways phase where the trend in the market is weak, then suddenly there is a significant spike in price movements that occur in a short time.
The ROC indicator which is an oscillator indicator can be used as a confirmation tool for this Breakout momentum. So if the price has passed one of the predetermined levels, then we can see the movement of the ROC line, whether there is a significant change or not.
.png)
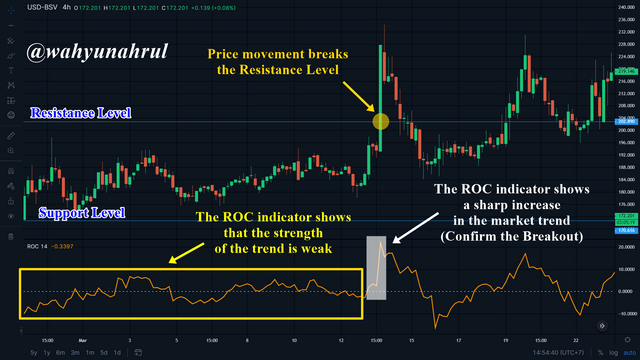
As an example of a breakout confirmed by the ROC indicator, we can see the USD-BSV chart picture above. Initially, the BSV price movement tends to be stable and we can see that on the ROC indicator line, there is no significant movement. Then I set Resistance Level at $170.616 and Support Level at $202.890.
After a while, the price of BSV experienced a very sharp increase that even passed the resistance level that I had previously made. Then the ROC indicator also confirmed the breakout by showing a very sharp movement of the ROC indicator line upwards and past the middle line.
Analyzing the USD-LUNA Chart Using Signals From the ROC Indikator Indicator
Now I will show you how to use the ROC indicator in the trading process on the cryptocurrency market. In this example I take the USD-LUNA market as an example of the analysis I will make, the timeframe I use is 4 hours with a long ROC indicator 14. Then I use an additional limit at level +/- 4 as the Overbought and Oversold Level limit.
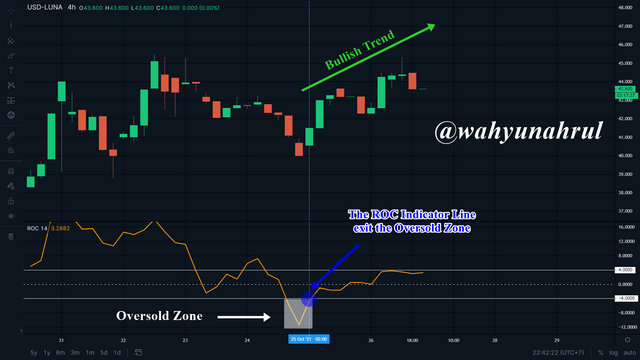
In the picture above I have entered the ROC indicator by setting it to a length of 14. Then we can see that the ROC indicator line is between the +/- 4 level, which means it is not in any zone yet. But if we look back we can see that LUNA just got out of the Oversold Zone a few hours ago, and if we look at the price movement of LUNA then we can see that LUNA is in a Bullish phase, this indicates "Buy Signal" for LUNA coins because the ROC indicator line has confirmed the LUNA price movement by showing the ROC indicator line has crossed the lower limit and its exit of the oversold zone.
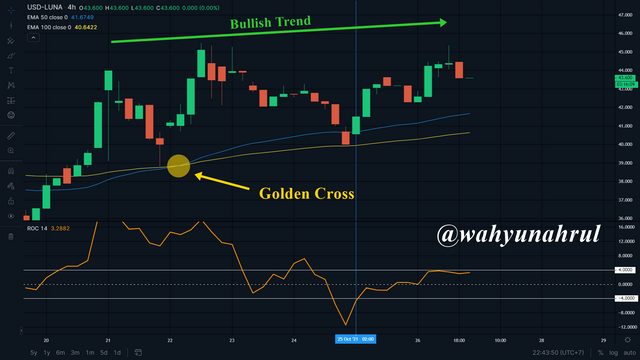
To confirm the signal given by the ROC indicator, I use another auxiliary indicator, namely Exponential Moving Average (EMA). Here I use 2 EMA lines with a length of 50 and 100 respectively, then we can see that these two lines intersected a few hours ago which cross is called "Golden Cross". The EMA50 line rose up until finally above the EMA100, this indicates that the current trend of the LUNA market has turned into a Bullish Trend a few hours ago. In other words, the EMA indicator confirms the buy signal given by the ROC indicator by showing that the trend is in a bullish phase and the price will continue to climb up.
Last Word (Conclusion)
The movement of trends that occur in the cryptocurrency market is an important thing for traders and investors to know, knowing what trends are happening and how strong the trend is, can be a consideration in terms of making long-term trading and investment decisions. The Rate of Change (ROC) indicator is one indicator that is able to provide information about market trends to traders and investors.
The Rate of Change (ROC) indicator which is a presentation of price changes from a cryptocurrency market is an indicator that is quite capable in terms of showing the movement of trends and prices in the market, it is able to show various buy and sell signals so that we can enter trades at the right time. most appropriate in the benchmark price. But we must also understand that this indicator will also be able to give false signals that can trap us. We must understand how to adjust the indicator length settings and we must also be smart in combining this indicator with other technical indicators in order to avoid these false signals.
Those are some of my explanations regarding the Crypto Trading With Rate Of Change (ROC) Indicator, I apologize if there are still many mistakes that you can get when reading my explanation earlier, I would be very grateful if you told me in the comments column below.
Thank you for reading my blog, hope it will be useful for all of you. 😁
Amazing work. Please let's support each other if you like finance too
Hi @wahyunahrul
I prefer to upvote users who continually powerup their earnings and continually upvote others with their increasing Steem Power. I notice you are in that category although you have not powered up SBD329 which is about 4000 Steem at current price. Hopefully you power that up soon to make your upvotes meaningful. Remember part of your upvotes comes back to you in earnings.
You will receive my upvotes regularly as long as you maintain this attitude.
Assalamualaikum bg 🙏
Saya ingin bertanya sedikit tentang crypto boleh bg
Saya ingin mengubah hidup ini jangan seperti ini² aja
Mohon bimbingannya bg kalau mau 🙏
Silahkan bg kalau ada yang ingin ditanyakan.
Saya akan mencoba menjawab sesuai dengan kemampuan saya.
Bg boleh saya kirim nomor wa saya bg
Biar lebih mudah saya bertanya di sana
Saya kurang aktif di WA
Silahkan chat saya lewat telegram, usernamenya sama dengan username steemit saya.
Siap terima kasih bg
https://steemit.com/hive-108451/@armstrongdiho/meme-tokens-crypto-academy-s4w7-homework-post-for-wahyunahrul
Prof. @wahyunahrul pls revisit my post and give me the required scores for my effort.
Hi @wahyunahrul
Thanks for participating in the Steemit Crypto Academy
Feedback
Total| 9.5/10
This is good work. Thanks for demonstrating such a clear and well detailed understanding of trading using Rate of Change indicator.
Thank you for the remark professor.
#club5050 😀