Volume Indicator - Crypto Academy / S4W2 - Homework Post for @kouba01
.png)
This post is the homework post for the lecture of @kouba01. I tried my best in the homework and learned new things from the lecture as well. I found this assignment very interesting.

Volume tells us how active an asset is and can indicate momentum and traders' sentiment towards it. In trading, Volume is used to verify price movements and analyze the strength of those movements. If the price goes up, but there's a low volume on the movement, it could be because the asset is not very active and doesn't have much momentum (and vice versa). Volume can also be used to find support or resistance levels.
Traders also use trading volume to determine whether an asset has enough market liquidity for trading. When there's low trading volume, it means that only a few traders are trading in that asset, and sometimes they might not be able to accumulate or sell a very large number of units. If a trader is trying to accumulate (or decrease their position), but there's no volume on the order book, or if there are very few traders, it could be hard to acquire (or decrease) enough positions. For example, if an asset has a trading volume of $10 million but your order is for 100,000 units, and there are only 10,000 units in the entire market, it will be hard to take up enough positions. Traders will often not want to go into very thinly-traded assets because it's hard to buy/sell large quantities (if even possible), or the market might be in a downtrend.
Volume is particularly useful for identifying trend changes - when volume starts increasing or decreasing before price does, it can indicate that strong momentum is building up behind price, which can often mean that price is about to increase or decrease rapidly.
How does the indicator help the trader?
The volume indicator will indicate whether there is enough market liquidity for traders to trade in an asset and large enough volumes for price momentum to build up behind certain movements. It's also used to analyze price movements and identify whether the momentum behind the movement is driving them.
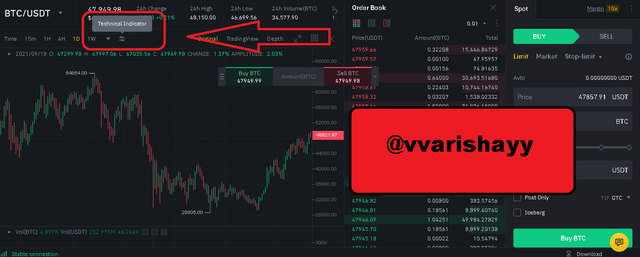
Step 1 is to select the option of technical indicator, as I am showing in the screenshot.
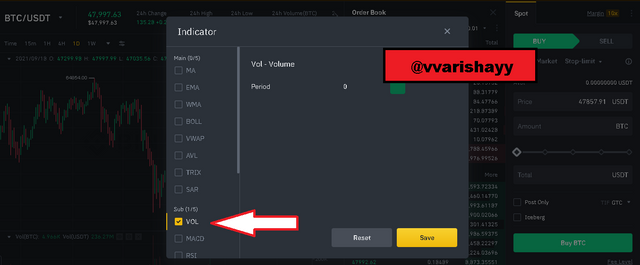
Step 2 is to select the volume option.
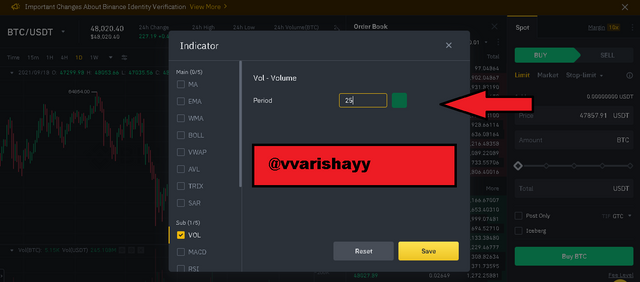
Step 3 is to select the period. I am choosing 25.
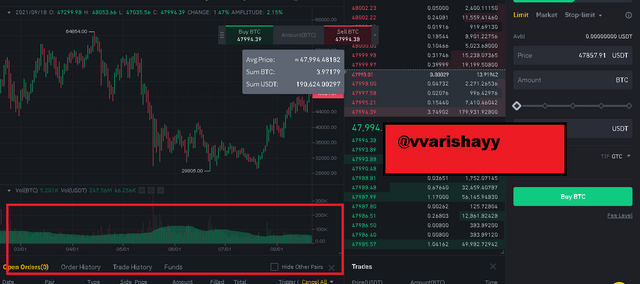
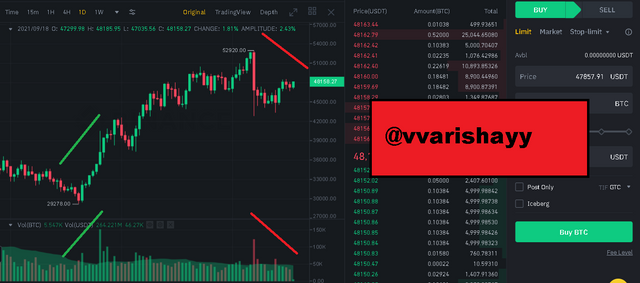
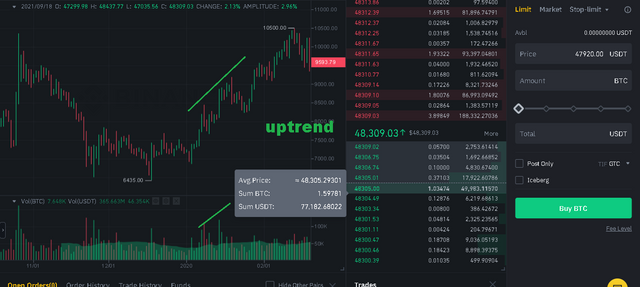
Now you can see the final result of the volume indicator. The volume indicator is a useful signal in cryptocurrency trades because it can help to confirm price action and technical analysis signals. For example, if you see three green candles in an uptrend accompanied by buying volume increase with each candle, it means that traders are more inclined to buy, and the uptrend is likely to continue. You can also look at volume together with other indicators to confirm a trading signal.
Volume can be used to predict trend reversals. When volume starts increasing or decreasing before price does, it can indicate that strong momentum is building up behind price, which can often mean that price is about to increase or decrease rapidly. This would suggest that the current trend will reverse.
You can't use volume to predict price moves or patterns - if you see that volume increases, it doesn't automatically mean that the price will increase. Volume at certain points can be used to support a trend within higher timeframes, but this is only done by analyzing different timeframes together (i.e., studying the volume on an hourly timeframe and seeing if there is support at certain price levels).
Technical analysis involves using many different tools to analyze trends, including analyzing volume. However, this tool (volume) will only tell traders where price momentum might follow; it doesn't predict exact price patterns or movements.
In addition, volume indicators show only the volume from the current timeframe. It doesn't show any historical data or give you an idea of how much trading activity has taken place in the past - it only shows the volume at a specific point in time. In this way, volume can often be misleading because the price can sometimes appear to be driven by high volume when it's old historical data driving the current price action.
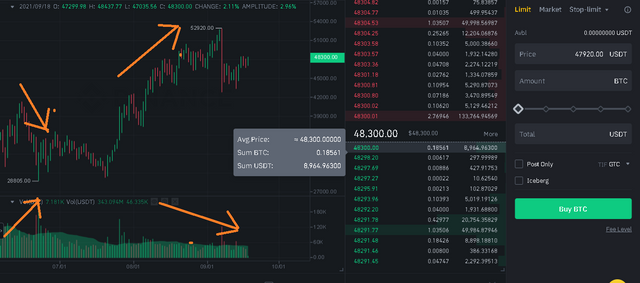
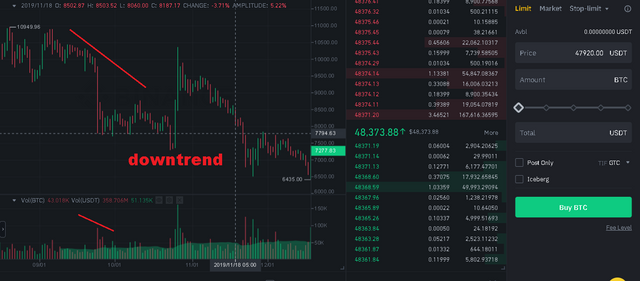
When the prices are bullish but the volume is decreasing, the Trend Reversal occurs. The market gets corrected, and we can observe a possible trend reversal at that time. So when we notice that the Volume and Prices are moving abnormally, we don't go into the market and wait for the appropriate moment. To discover the trend reversal, we need to switch from a daily chart to a 4-hour chart. And if we don't find any bullish or negative candle on this time frame, then it means that there is no more momentum pushing the price in a specific direction, and it will go back to its mean value.
You can use volume as a confirmation tool to determine whether the trend is real and not just based on speculation. If you see that price increases or decreases according to your trading timeframe, but there's low volume, it might not be backed up by strong enough momentum for the movement to continue.
Using Volume as a Confirmation Tool: if the price is in an uptrend, but volume is low and not confirming the price action movement, there might not be enough momentum behind the trend to keep it going. If this happens, traders should look for a reversal signal.
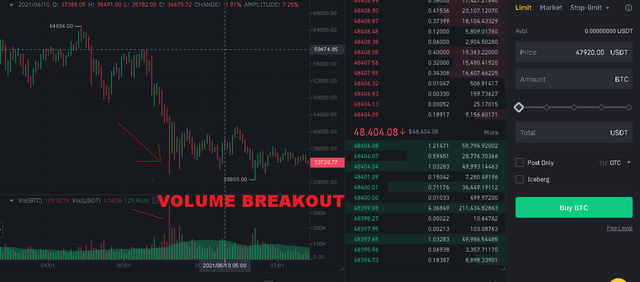
Support Level Breakout
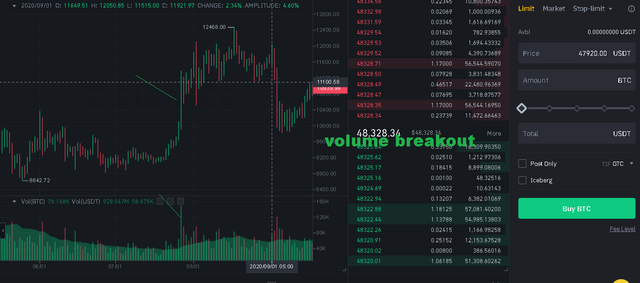
Resistance Level Breakout
Volume is directly related to the price - when you see higher volume, it means buyers or sellers are active in the market.
As mentioned before, volume confirms the current trend by showing whether enough people are trading in an asset for price momentum to build up. When volume starts increasing or decreasing, it will show whether traders are more inclined to buy or sell. Traders therefore use volume to get an idea of how strong the momentum is behind price at any given time; when buying momentum increases and prices increase on high volume, this suggests, there is the strength behind the move (and it's likely to continue), whereas if the price action moves up against a current trend. Still, on low volume, it suggests there is not enough buying momentum to continue.
You can use volume as a stand-alone indicator when you are looking for simple trading signals. For example, if you see three green candles in an uptrend accompanied by buying volume increase with each candle, it means that traders are more inclined to buy, and the uptrend is likely to continue. You can also look at volume together with other indicators to confirm a trading signal. There's nothing wrong with using the volume indicator on its own. Many traders use it as a stand-alone tool to develop trading ideas and confirm that those trading ideas are valid. However, traders should also be aware of other market indicators and events (e.g., fundamental news) which could affect the price action and alter their trading decisions.
The most common way is to see whether the price is accompanied by high or low volume on a specific timeframe; if there's high volume, it means that the momentum is strong and price will likely continue in that direction, whereas if there is low volume, it suggests that the price movement is being driven by speculation and might not have enough momentum to continue. A second way you can use volume is to see whether there are many buyers or sellers in the market at a given time. If there are more buyers than sellers, this supports the current trend; if there are more sellers than buyers, it suggests that the trend might reverse.
Finally, volume can be used to confirm technical analysis signals generated by other indicators.
In conclusion, volume is used by traders to get an idea of how strong the momentum is behind price at any given time; when buying momentum increases and prices increase on high volume, this suggests that there is the strength behind the move (and it's likely to continue), whereas if the price action moves up against a current trend. Still, on low volume, it suggests there is not enough buying momentum to continue. Volume can be used as a stand-alone indicator when you are looking for simple trading signals. For example, if you see three green candles in an uptrend accompanied by buying volume increase with each candle, it means that traders are more inclined to buy, and the uptrend is likely to continue. You can also look at volume together with other indicators to confirm a trading signal. Another way you can use volume is to see whether there are many buyers or sellers in the market at a given time. If we have more buyers than sellers, this supports the current trend; if there are more sellers than buyers, it suggests that the trend might reverse.
The most common way is to see whether the price is accompanied by high or low volume on a specific timeframe; if there's high volume, it means that the momentum is strong and the price will likely continue in that direction, whereas if there is low volume, it suggests that the price movement is being driven by speculation and might not have enough momentum to continue. A second way you can use volume is to see whether there are many buyers or sellers in the market at a given time. If there are more buyers than sellers, this supports the current trend; if there are more sellers than buyers, it suggests that the trend might reverse.
Please verify my achievement @vvarishayy
Nice post madam😊😊
Hi @vvarishayy
Thanks for participating in the Steemit Crypto Academy
Feedback
This is good content. Thanks for expressing your understanding of Trading using the Volume indicator.
Total| 8.5/10
Thank you for the feedback professor. My pleasure.
Mam verified my achievement3 Task content etiquette.
https://steemit.com/hive-172186/@qadeerarif546/6ygjhe-achievement3-by-qadeerarif546-task-content-etiquette
Nice post verify me
https://steemit.com/hive-172186/@alihasnain8/achievement-2-alihasnain8-task-basic-security-on-steem
Excellent work mam
Maidem my achievement-2 post.
https://steemit.com/hive-172186/@sameeralii/achievement-2-or-or-basic-on-security-or-or-20-09-2021
Ma'am @vvarishayy
Plz verify my achievement 3
https://steemit.com/hive-172186/@adnanahmad/achievement-3-by-adnanahmad-task-or-or-content-etiquette
here is my achievement please verify it
https://steemit.com/hive-172186/@ahtashamch456/achievement-1-through-my-introduction-at-steemit-by-ahtashamch456
here is my achievement link please verify
https://steemit.com/hive-172186/@captansab/achievement-3-task-content-etiquette-by-captansab