Crypto Trading With Rate Of Change (ROC) Indicator - Crypto Academy | S4W8 - Homework Post for @kuoba
Hello Everyone,
I loved the previous lesson about CMF Indicator from prof. @kuoba. This week once again we have an opportunity to learn about another indicator which is the Rate Of Change (ROC) Indicator. Let's dive into the homework.

In your own words, give an explanation of the ROC indicator with an example of how to calculate its value?And comment on the result obtained

- Introduction to Rate Of Change (ROC) Indicator
As the name suggests, this indicator measures the price change based on percentage terms between the current price and the price a certain "n" number of periods ago. The value is then plotted and fluctuates against the centerline of the indicator the Zero line. The fluctuation indicates overbought and oversold conditions of the market in negative and positive values. Hence, the ROC indicator can be identified as a momentum oscillator and is often referred to as simply Momentum.

Rate Of Change (ROC) Indicator
When the Rate Of Change (ROC) Indicator is applied on a chart, there are two lines we should focus on. The first is the ROC line plotted here in "green" line which indicates the ROC value. The second one is centerline "0". We can see the green line fluctuates against the centerline with several crossovers indicating a positive value when the ROC line is above the centerline and a negative value when the ROC line below the centerline.

Signals from Rate Of Change (ROC) Indicator
As to the above figure, we can see that the indicator shows -0.2726 as ROC value and the ROC line is below the centerline of "0". Usually, this value is calculated based on 12 periods inputs but a trader can always change this setting as to his preference. Common settings vary between 09 to 25 periods according to the trading pattern where short to long term charts.
A technical analyst may use this data to analyze the market trend to confirm the price moves and overbought and oversold conditions in the market.
ROC value can be interpreted as follows:
The indicator calculates and provides a number which is positive or negative. When there is a positive number the ROC line is plotted over the centerline, indicating bullish movement in recent periods. Conversely, when there is a negative number, the ROC line is plotted below the centerline and this will indicate the bearish movement of the price in recent periods. This is the basic interpretation of the ROC value.
- How to calculate its value
To calculate the Rate Of Change we only use two variables, and just one simple formula to get the value,
ROC = [(Close - Close n periods ago) / (Close n periods ago)] x 100
Close represent the current close value of the period we take, for example, I'm going to take XRP/USDT 1 day chart. So, for the 12th of Oct, we can see the close value at 1.1023. For the number of periods back I'm going to use 12. We can see the ROC value at 15.6542 as of 12th Oct. Let's calculate and find out whether I can get the same number from the above formula.
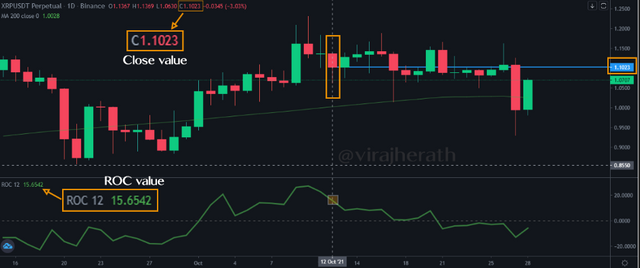
Calculation variables for the Rate Of Change value
XRP/USDT| 1D | binance.com
| Date | |||
|---|---|---|---|
| 30-Sep | Close 12 days ago (Value for 12th Oct) | ||
| 1-Oct | Close 12 days ago (Value for 13th Oct) | ||
| 2-Oct | |||
| 3-Oct | |||
| 4-Oct | |||
| 5-Oct | |||
| 6-Oct | |||
| 7-Oct | |||
| 8-Oct | |||
| 9-Oct | |||
| 10-Oct | |||
| 11-Oct | |||
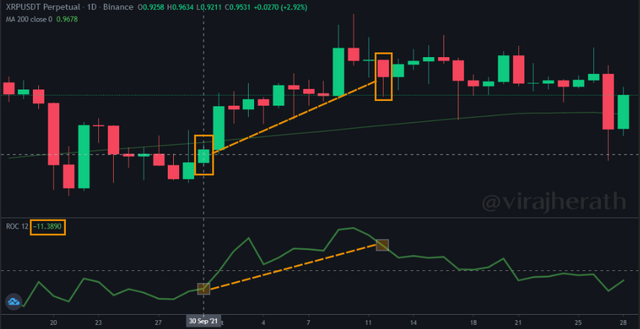
| 12-Oct | ROC as at 12th =[(1.1023 - 0.9531)/0.9531]*100 | ||
| 13-Oct | ROC as at 13th =[(1.1284 - 1.0421)/1.0421]*100 |

The ROC Volume of 12th & 13th Oct 2021
XRP/USDT| 1D | binance.com
- Comments On Result
Both results are positive numbers (12th - 15.6542 & 13th - 8.2814), which indicates an overbought condition compared to 12 days back. With the result we can say that the price has increased over 12 days and having a bullish movement. However, 13th we can see close to 50% momentum has decreased from the previous day. This could be an indication that the selling pressure is back on the market for that pullback.
The result indication
XRP/USDT| 1D | binance.com
Demonstrate how to add the indicator to the chart on a platform other than the tradingview, highlighting how to modify the settings of the period(best setting)
I have used binance.com to demonstrate this task. Once signed in, we can choose the trading pair. I'm going to choose XRP/USDT. The chart will appear on "Original" mode in default, but we have to switch to the "Trading View" mode to add the ROC indicator.

Adding ROC indicator to the trading chart
XRP/USDT| 1D | binance.com
Once selected, ROC will appear bottom of the trading chart.
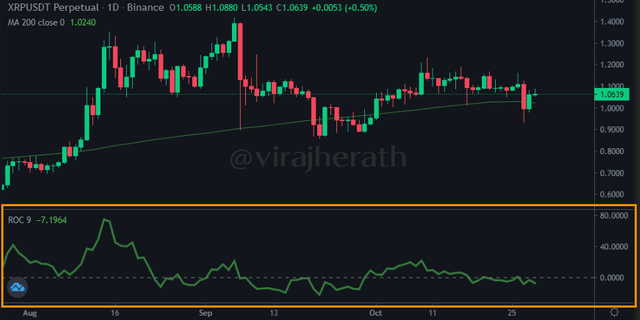
ROC indicator on the trading chart
XRP/USDT| 1D | binance.com
The default settings for the ROC is 09 periods, but we can change this just by clicking "Settings" according to our preference.
◾ Inputs: Look for "n" number of periods ago closing price, I'm going to change this to "12"
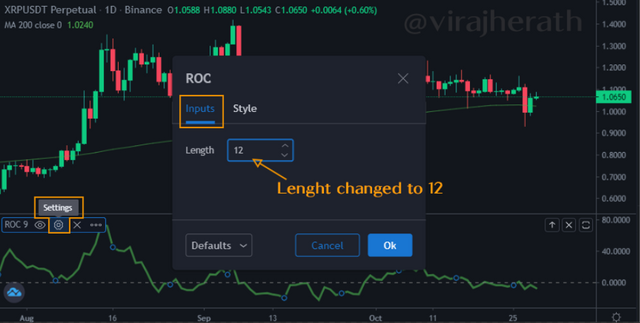
ROC indicator Input settings
XRP/USDT| 1D | binance.com
◾ Style: Appearance of the two line - ROC & Zero line

ROC indicator style settings for visibility
XRP/USDT| 1D | binance.com
- Best Settings for ROC
The default setting for the input is "09" periods. However, there are no such best settings for any indicator but according to the preference of the trader's trading method, the setting can always be changed. Some of these so called best settings might have their merits but they can also give you the result you don't want.
That has been said, ROC input of 12 to 25 is what most analyst recommend to use for short and medium term trading. If we take a closer look at the below figures, you can see that once the ROC input is higher the overbought condition too gets higher on ROC percentage value. This is a good example to understand that there is no upward boundary on the ROC percentages and it can be skyrocketed to any amount.
Hence to get more reliable data for a short term trader, he can use shorter periods between 9 to 14 while a long term trader can use higher periods between 14 to 25. That would be the most recommended setting for ROC.
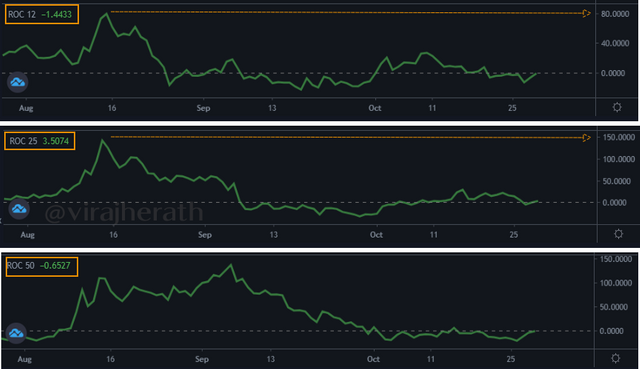
Demonstration of different ROC inputs on the same chart
XRP/USDT| 1D | binance.com
What is the ROC trend confirmation strategy? And what are the signals that detect a trend reversal?
- Trend confirmation strategy
The momentum oscillators always interpret moves from the equilibrium point which appeared as "zero" the centerline. When the markets are in this equilibrium state we can say that the buyers and sellers are in agreement over the price action. However, when there is a disagreement on the price we can see buyers or sellers reacting to the market demand and supply where we see impulsive moves. When this moves in one direction we can say that the market is on a trend.
These trends can be spotted in the ROC indicator with crossovers from the centerline. As to the below figure we can see such two occasions to confirm the bearish trend and bullish trend from the centerline. Moreover, when there are more crossovers in the centerline in the specific time period we can see the market consolidate and move sideways.
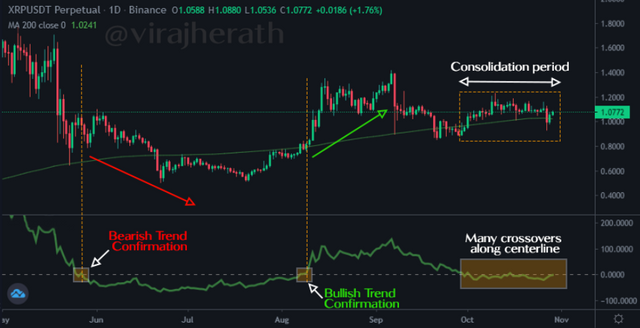
ROC trend confirmation strategy
XRP/USDT| 1D | binance.com
Hence, it is safe to say that the centerline crossovers give signals for the trend continuation and as a trader, this can be confirmed from the next candlestick with the similar result indicating in price action. However, this might not be true for every single occasion and like any other indicator ROC is too prone to provide fake signals here and there.
- Trend reversal
While signaling out the trend confirmation from centerline crossovers, ROC can provide a signal for upcoming trend reversals as well. Usually, there are 02 ways to identify the reversal,
(i). Divergences
(ii). Overbought-oversold readings
◾ Divergences
Divergence can be found when there is a contrast between the directions of price trend line and the ROC line. Simply both directions will have different patterns which not comply with the price action. This phenomenon may suggest that the current trend is diminishing its strength and there a trader can take advantage to enter the market early.

Trend reversal: Divergences
DASH/USDT| 1H | binance.com
◾ Overbought-oversold readings
When the ROC indicator exceeds the value of +/- 3 or more, it is possible to interpret the condition as an overbought or oversold of the market. This phenomenon would eventually change because in the market buying and selling are just two opposing forces where one could not hold longer period. Hence we can see in the below figure, whenever the ROC line enters the +/- 3 it quickly reverses according to the price action.
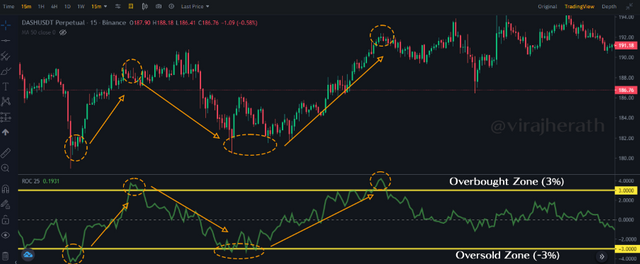
Trend reversal: Overbought-oversold readings
DASH/USDT| 1H | binance.com
What is the indicator’s role in determining buy and sell decisions and identifying signals of overbought and oversold؟
From the previously described point, we can see that there is a high chance for a pullback of prices when the ROC value exceeds the +/- 3 zone which we identified as the overbought and oversold zone. We can use this as a strategy to enter to the market after clarifying the position with another indicator and signals from chart patterns, candlestick patterns.
As to the below figure we can notice that when the ROC value reaches to the +3 overbought zone, the price has pulled back to reverse the trend, as a trader this can be seen as a good opportunity to enter to Sell position. Conversely, when the ROC value reaches to the -3 oversold zone, the price has bounced back to reverse the trend. This can be a good opportunity to enter the market for Buy position.

Determining buy and sell signals through overbought and oversold condition
DASH/USDT| 1H | binance.com
The must for any position is to have risk management since we expect a reversal while the trends are in hot zones. There can be unexpected impulsive moves if we do not refer to larger time frames to understand the bigger picture. Hence, it is important to research and do historical analysis to clarify the overbought and oversold positions.
How to trade with divergence between the ROC and the price line? Does this trading strategy produce false signals?
As explained earlier divergence happens when there is a contrast between the directions of price trend line and the ROC line. However, this divergence is not a confirmed reason to take position against the current trend. It is more of an initial signal to confirm that the trend is losing its conviction.
Hence, as a trader, we can assume that the reversal is somewhat possible in the near future. There we have an option to take an early position with some risk involvement or wait for the confirmation from any other indicator or signal from candlestick pattern or chart pattern.
The divergence can occur in two scenarios,
◾ 01). Bullish divergence:
This type of divergence can occur when there is a bullish movement from the ROC line while the price structure has a bearish trend. The theory behind such phenomenon is that ROC indicates percentage change to the current price from the n numbers period back price. Therefore, the ROC value might indicate the buying pressure market had but sellers are quite aggressive to pullback the price.
However, seller's exhaustion eventually reverses the price. We can see in below figure there are about two slight pullbacks before the reversal. All these can be a signal but the latest entry point will give the maximum profit to the trader. However, if we look for a safe and more sound entry point we can wait until the ROC confirmed the reversal by crossing the centerline.
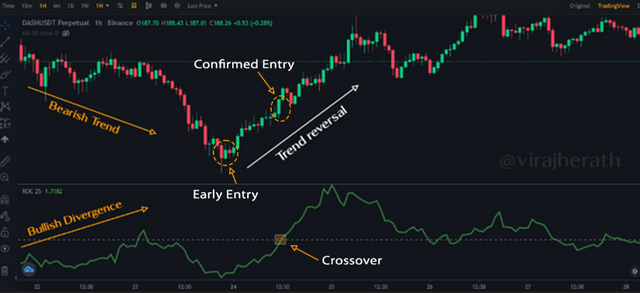
ROC Bullish divergence
DASH/USDT| 1H | binance.com
◾ 02). Bearish Divergence:
This type of divergence can occur when there is a bearish movement from the ROC line while the price structure has a bullish trend. Conversely to the bullish divergence, here the buying pressure gets weakened over the sellers. A similar strategy can be used to get more profit entering the market early with risk management but the sound decision would be to wait for the confirmation from the crossover.
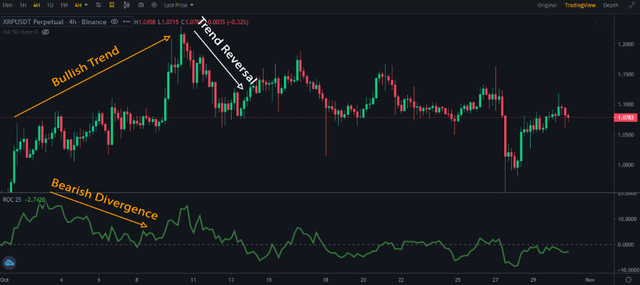
ROC Bearish divergence
XRP/USDT| 4H | binance.com
False signals
In the above figure, we have perfect divergence and trend reversal too. However, you can see that it has not reversed as expected from the centerline crossover but there are multiple corrections there onwards. This can happen in any indicator as indicators just provide the signals from the previous data. The future is always unpredictable in that case.
This is the reason why we can not depend on a single strategy and single indicator to make our decisions in trading. A trader must not predict the future but understand the market forces at any given time to make sound decisions.
How to Identify and Confirm Breakouts using ROC indicator?
Breakouts occur when the key levels of support and resistance fail to hold the accumulation or distribution phases. Whenever breakouts occur traders tend to treat it as a trend phase and enter the market for a trend continuation. However, there are many fake-outs in the market and traders might trap and lose their position.
To confirm these breakout ROC can be a significant tool, because breakouts need a strong momentum in price change. Such changes will indicate in ROC value as a sharp movement.

ROC breakout confirmation
ETH/USDT| 1H | binance.com
I the above figure we can see the price movement is consolidating between the support and resistance levels. The same can be confirmed with the ROC line along the centerline. Then there is a strong price pullback breaking the support level. ROC has indicated that sharp movement and just after that there is a confirmation to that breakout with another strong bearish candle.
Review the chart of any crypto pair and present the various signals giving by ROC trading strategy.
For this part of the question I like to review the ETH/USDT 1H chart. I have used 25 periods for ROC input value.
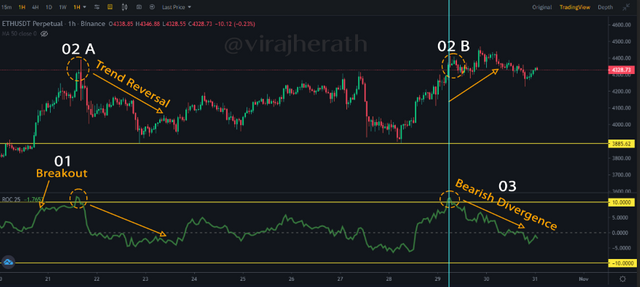
Market review using ROC indicator
ETH/USDT| 1H | binance.com
◾ 01). I have a support level of 3885.62 which was previously acted as a resistance level until 20th Oct. It was broken with bullish momentum and it was indicated in the ROC with sharp upward momentum.
◾ 02). Here I have taken 10% as the overbought zone. We can see that two instances where it has broken. I have numbered the first occasion with 02A and the second occasion with 02B.
In 02A the trend was reversed as expected, while the 02B occasion had a slight pullback but continued its upward direction. Hence, we can consider 02B as a false signal.
◾ 03). From the 02B point onwards we can see a divergence as well. The ROC value decline over the period while price action continued uptrend indicating a bearish divergence pattern. We can see the momentum has shifted to a downtrend confirming the buyer exhaustion. This can probably consider as an opportunity to enter the market with a sell position after proper analysis with another indicator too.
Conclusion
ROC is a momentum indicator which has similar functionality to MACD, CCI, RSI. However, ROC has different characteristics for a technical analyst to analyze the market condition.
ROC can calculate the value of price change as a percentage which can be plotted against the market equilibrium to identify the overbought and oversold conditions. The divergence can signal out the trend reversal while crossovers may suggest trend continuation.
The ROC indicator can be implemented in any time frame and any trading type. The number of the look back period can be changed according to the user preference. The most recommended range would be to use 12 to 25 periods.
All in all, the ROC indicator is most recommended to use as a confirmation tool to analyze the market in conjunction with another indicator or trading strategy to filter out the false signals.
Thank you prof. @kuoba for sharing the knowledge of this valuable technical analysis tool.
Hello @virajherath,
Thank you for participating in the 7th Week Crypto Course in its 4th season and for your efforts to complete the suggested tasks, you deserve a Total|9.5/10 rating, according to the following scale:
My review :
Excellent content in which you were able to answer all questions related to the ROC indicator with a clear methodology and depth of analysis which is a testament to the outstanding research work you have done.
Thanks again for your effort, and we look forward to reading your next work.
Sincerely,@kouba01
Thanks for the review prof. @kouba01
Great job.
Very Nice information about Crypto Trading With Rate Of Change (ROC) Indicator. Always success for your My Friend 👍😊
Thanks for sharing report of change in crypto trading:-) I hope you enjoyed in trading crypto by using ROC
@virajherath
Indeed, I did enjoy all these valuable lessons.
#club5050 😀