Crypto Trading with Average True Range (ATR) Indicator - Crypto Academy | S5W1 - Homework Post for @kuoba
Hello Everyone,
After 02 weeks break we are back with season 05. Crypto prof. @kuoba has started with where he left off in season 04. This week he introduced Crypto Trading with Average True Range (ATR) Indicator. Let's dive into the homework.

Discuss your understanding of the ATR indicator and how it is calculated? Give a clear example of calculation

- Introduction to Average True Range (ATR) Indicator
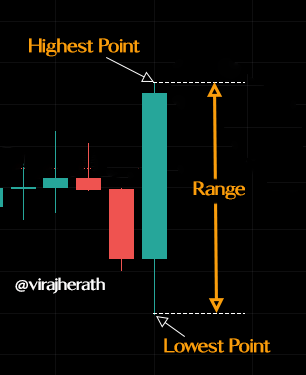
The concept of True Range (TR) was developed by the famous trader J. Welles Wilder in the 1970s. He believed that the "range" (the distance the price moves from the highest point to the lowest point of the bar) is directly proportional to volatility.
The volatility in the market defines according to the price action over a given period. We as traders consider active markets as volatile: meant to say that the range is higher, and inactive markets as less volatile: meant to say that the range is lower.
In the 1970's, long before the crypto market appeared, traders were used to trading in commodities. Compared to stocks, commodities are prone to high volatility and seasonal distortions. In such markets understanding the volatility is essential as high volatility can generate a lot of false signals.
Hence to measure the volatility in the market, Wilder used True Range (TR) concept using the greatest distance between the following scenarios .

Three possible scenarios of True Range
- Scenario A: Current High - Current Low
Used when the range of the current candlestick is wider than the previous candlestick's price.
- Scenario B: Current High - Previous Close
Used when the current candlestick closes higher than the previous candlestick's price.
- Scenario C: Current low- Previous close
Used when the current candlestick closes below the previous candlestick's price.
With the above scenarios, we can notice that the smaller prices will always subtract from the larger price no matter if it closing or opening. Because of this calculation method we will always get an absolute value for the true range. Hence, even if the market trending as an uptrend or downtrend we only can see the positive values in the ATR indicator.

ATR will indicate only positive values
Now that the range is measured using the above scenarios, to use it as a volatility measurement more than one day's range must be considered. When we have more scenarios with more candlestick's price It can give us the Average we look for. By default 14 periods are set as the number of periods on the Average True Range (ATR) Indicator.
- How to calculate its value
The formula to calculate ATR is,
Current ATR = ((n-1) x previous ATR) + Current TR )) / n
n = number of periods
Now let's calculate this with a practical example. I'm going to take 07 periods for this example and the ATR will be based on daily data of XRP/USDT tradingview.com chart.

ATR value on 07th Nov 2021: 0.0826
XRP/USDT| 1D | tradingview.com
◾ As a first step, I have collected data (High, Low & Close prices) from the trading chart between 01st Nov to 07th Nov.
◾ To find the True Range (TR), I have checked the greatest value between three possible scenarios.
True Range = max ( High – Low of the day, Current High – previous close, previous close – Current Low)
◾ Then I multiply the previous day's ATR by 06 and added the most recent TR value.
◾ Finally, I have divided the total by 07.
| High | Low | Close | H - L | C.H - P.C | C.L - P.C | TR | ATR | |
|---|---|---|---|---|---|---|---|---|
| 1-Nov | 1.1321 | 1.069 | 1.0915 | 0.0631 | 0.0631 | |||
| 2-Nov | 1.1468 | 1.0851 | 1.1349 | 0.0617 | 0.0553 | 0.0064 | 0.0617 | |
| 3-Nov | 1.2363 | 1.1255 | 1.2101 | 0.1108 | 0.1014 | 0.0094 | 0.1108 | |
| 4-Nov | 1.2574 | 1.1604 | 1.2004 | 0.097 | 0.0473 | 0.0497 | 0.097 | |
| 5-Nov | 1.2015 | 1.1311 | 1.1581 | 0.0704 | 0.0011 | 0.0693 | 0.0704 | |
| 6-Nov | 1.1828 | 1.1 | 1.151 | 0.0828 | 0.0247 | 0.0581 | 0.0828 | 0.0810 |
| 7-Nov | 1.2374 | 1.1451 | 1.2198 | 0.0923 | 0.0864 | 0.0059 | 0.0923 | 0.0826 |
Since I have taken 7 periods, the formula adjusted as below:
07th Nov ATR = ((06 x 0.0810) + 0.0923) / 7
07th Nov ATR = 0.0826
You can see that the values are exactly same and the calculation is successful.
What do you think is the best setting of the ATR indicator period?
As mentioned earlier, the default setting for the ATR is "14" periods. Wilder, the founder suggested that 14 periods give the best indicator of volatility for use of volatility index. However, there are no such best settings for any indicator but according to the preference of the trader's trading method & the time frame he trades, the setting can always be changed.
However, as a trader, we must know what is the difference between different settings. Hence, I like to take 7,14 & 28 periods as examples to demonstrate the different outcomes.
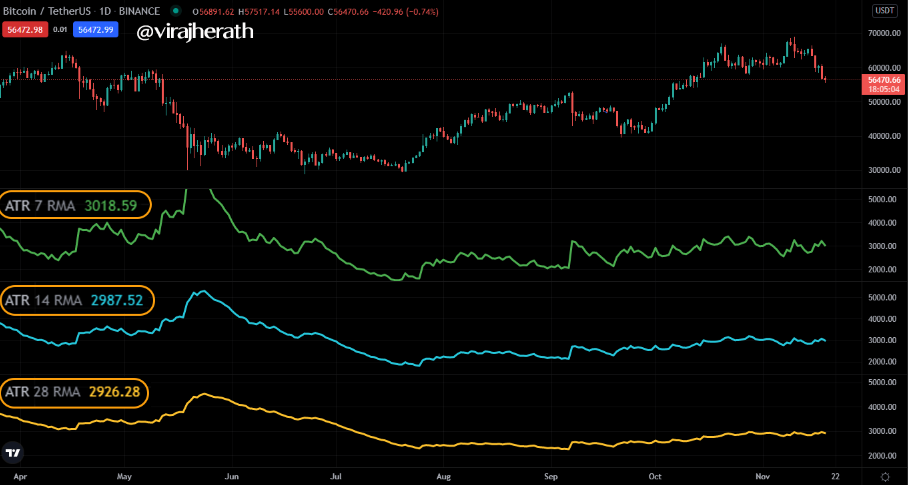
Different input settings on ATR Indicator
BTC/USDT| 1D | tradingview.com
As to the above figure, you can see that different inputs provide different ATR values and more importantly the ATR lines are more smooth and provide less noise when the value is higher. This interprets that, when there is low value input (07 for example) the indicator reacts to the recent price actions and hence provides faster acting ATR than the volatility index. This method could be useful for the short term time period traders to get quick signals. However, there is a risk for accuracy.
When the ATR input is set to above 14 periods we can see that the line is more settled. This is because it takes more data to interpret the line. This provides an accurate more reliable volatility index compared to lower inputs. Hence, this setting is suggested for long-term traders.
How to read the ATR indicator? And is it better to read it alone or with other tools? If so, show the importance.
ATR is an oscillator which displays the value from a line graph. Hence, it is very easy to interpret the data from the indicator. When the value of the ATR increases the line will go up and conversely, when the value decreases the line will go down.
The way we interpret this up and down momentum of the line is that, rising ATR means to say the volatility is increasing and higher ATR will indicate a trend, whilst falling ATR indicates low volatility. When the market consolidates, the ATR is likely to have a falling ATR or low volatility.

How to read the ATR indicator
BTC/USDT| 1D | tradingview.com
One thing to note is that ATR is not a directional indicator. Hence, it will not move with the price action trends like most oscillator-type indicators.
- ATR indicator with Parabolic SAR
Like any other indicator, ATR too has its merits and limitations. ATR is a reliable indicator to show us up/down trending or consolidation of the market. Thus, when we make buy and sell decisions it may lack use. Because of that, we as traders can use the help of other indicators to make sound decisions.
One of the best indicators which go with ATR is Parabolic SAR (Stop and Reverse). SAR is able to identify the most extreme trend points on uptrend or downtrend. It has dots either below or above the candlestick to indicate the bearish and bullish energy on a trend.
Once both were added to the trading chart it looks like the below figure and I have highlighted the two scenarios as A & B.

ATR & SAR on a trading chart
BTC/USDT| 1h | tradingview.com
◾ Scenario A: We can see that there is a slight momentum indicated on ATR indicator and it confirms with the candlestick body. The volatility increased and then decreased as a basic theory to demand and supply. If we only use ATR we might exit from the trend without taking the full potential benefit from the current trend. But SAR helps to identify the ongoing trend though the volatility decreases.
◾ Scenario B: Here we can see a huge volatility increase followed by a huge decrease. This time SAR will be really useful to step out from this trade. In fact, when both of these indicators are used together it is quite easy to set stop loss in our trading. Because SAR can act as a trailing stop to the stop loss limit.
How to know the price volatility and how one can determine the dominant price force using the ATR indicator?
It is quite evident that when there are larger candle bodies around the chart pattern there is high volatility, whilst small bodies represent less volatility in prices. Since ATR uses data from the previous price actions (by default 14 periods) it will give us an absolute value and the line will oscillate in positive values with up and down momentum.
As explained before, rising ATR means to say the volatility is increasing and a higher ATR value will indicate a trend, the trend can be bearish or bullish. Falling ATR indicates low volatility. When the market consolidates, usually we can witness the falling ATR or low volatility.
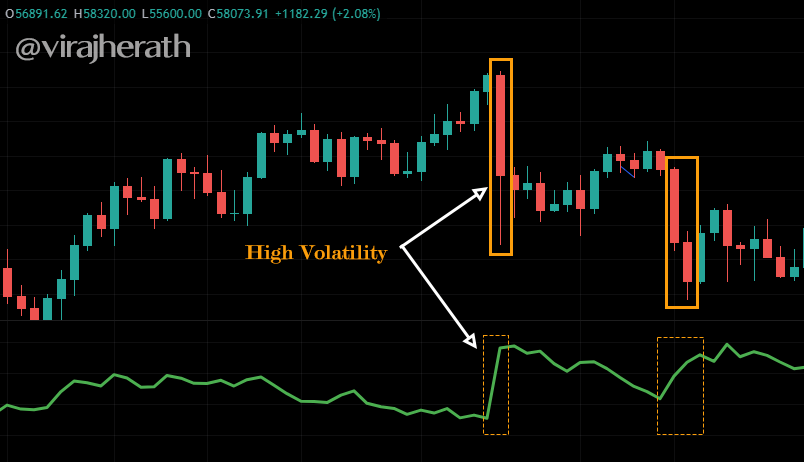
ATR line graph with price action
BTC/USDT| 1h | tradingview.com
In the above image, we can see that the candlestick has a quick bullish momentum and it was picked by the ATR indicator with a quick spike indicating higher volatility on both occasions. This is a good example to show how the ATR reacts to price volatility.
In the below figure we can see the market structure as a macro picture for nearly over 01 year period. When there is low volatility in the market it is very clear that the price has less volatility which represents small candlestick bodies with narrow price range.
when the volatility increases gradually we can witness the price action starting to swing both up and down positions. Then again even with higher volatility value we can see market is in a consolidating period. From May onward we can see a high volatility increase with an uptrend to the price, followed by volatility decrease. In this phase of the time, though the volatility decrease we can see that the price action moves in range suggesting consolidation of the price. Then again after August we can see a break up to structure with strong bullish movement with high volatility on ATR.
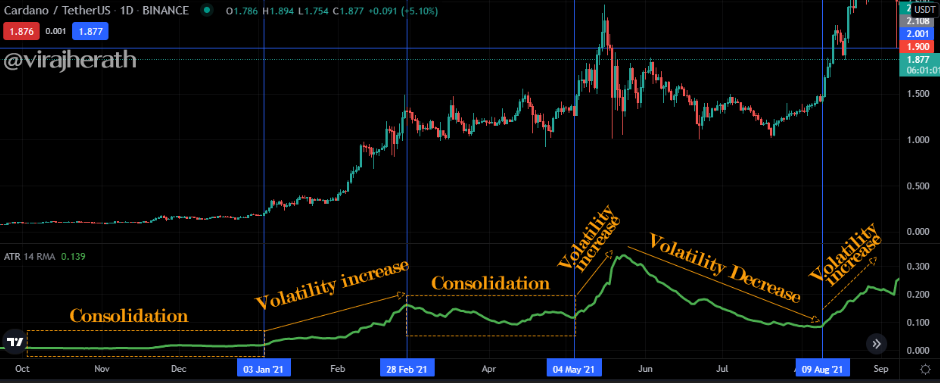
ATR interpretation of different market structures
ADA/USDT| 1D | tradingview.com
How to use the ATR indicator to manage trading risk ?
To make a good trading entry a key element should be in place, and that is risk management. No matter how accurately we analyze the market, there can always be some unexpected situations which will put our investment in danger. To stop the loss or minimize it, we have to have a proper and systematic risk management strategy.
ATR as a volatility indicator can help to identify the correct measure to set stop loss in our trading positions. The formula is,
Stoploss: Entry point +/- 3 x ATR
Let's assume that I have entered the ADA/USDT market at 1.86 USD. The current ATR for ADA is 0.139. I'm going to set 1 : 1 risk : reward ratio for my positions. Then as per the formula my stop loss would be,
- Short position
Stoploss: $1.86 + (3 x 0.139)
Stoploss: 2.277

Stop loss set up using ATR value
ADA/USDT| 1D | tradingview.com
- Long position
Stoploss: $1.86 - (3 x 0.139)
Stoploss: 1.443

Stop loss set up using ATR value
ADA/USDT| 1D | tradingview.com
The suggested method is just for the safe of trade and this value can be changed according to how much risk can be taken for the particular trader. In general, the best practice would be to use fairly wide stop loss, at least more than 03 times average true ranges from the position we enter.
How does this indicator allow us to highlight the strength of a trend and identify any signs of change in the trend itself?
Market structures are flooded with price action data which has many trends. To reveal clues about the current trend we use many indicators, chart patterns and candlestick patterns. ATR as a volatility indicator is a useful tool to understand the market underlying forces. However, we must understand that ATR is not a directional indicator, hence does not act as other oscillators such as RSI or MACD.
When we see the values of ATR we can see strong impulsive momentums (up or down) and gradually increase of values and decrease of values. Generally when there is a strong spike it may indicate a beginning of a trend.
In the below figure we can notice sudden spikes in ATR values on 03 occasions and all these occasions have indicated a very strong momentum for the direction of the particular trend before it eventually goes back to the consolidation.

Strength of a trend
BTC/USDT| 1D | tradingview.com
- Signs of change in the trend
Trends reverse due to the exhaustion of either market demand or supply. Since the market volatility underlying supply and demand as a degree of variation, we can use this theory to understand the trend reversal in price action.
When there is low volatility or decreasing volatility in ATR value, we can expect the price action to be consolidating. This indicates that, market pressure for the buyers or sellers are exhausted and one of the party will eventually take over and break out from the contraction.

Trend reversal
BTC/USDT| 1D | tradingview.com
In the above figure, we can see that the volatility value decreases over the consolidation time and then when it increases we can see that price action momentum goes to the bearish indicating a downtrend.
List the advantages and disadvantages of this indicator:
Advantages
◾ The main advantage of ATR is that it represents the volatility variation and the range from previous price actions, these are fundamentally important for accurate technical analysis. Hence, using ATR can help to make sound decisions when combined with other indicators such as CCI, Parabolic SAR & Zig Zag.
◾ The indicator is visually simple and easy to interpret. As it uses only absolute values a trader even can do mathematical equations in mind.
◾ While it gives valuable information to buy and sell decisions, ATR can help to find accurate Stop loss levels as well. As a method, we have used 03 times of ATRs value.
◾ The indicator is capable to use in anytime frame and for any trading method. A trader can adjust the input periods according to preference.
Disadvantages
◾ ATR value does not predict anything but simply provides the average true range using historical data. For the best practice, traders must use another tool for valid signals.
◾ ATR is not a directional indicator. Hence, if not studied how this works a novice trader might confuse with the divergence it creates.
Conclusion
Average True Range (ATR) is an indicator that measures volatility over some defined period. Usually, the period is 14 days. It is a great tool when combined with other indicators. The simplicity of the line graph is easy to interpret the data. The value of ATR can be helpful to decide logical stop loss levels.
Thank you prof. @kuoba for sharing the knowledge of this valuable technical analysis tool.
Hello @virajherath,
Thank you for participating in the 1st Week Crypto Course in its 5th season and for your efforts to complete the suggested tasks, you deserve a Total|9.5/10 rating, according to the following scale:
My review :
Excellent content in which you were able to answer all questions related to the ATR indicator with a clear methodology and depth of analysis which is a testament to the outstanding research work you have done. And here some notes :
A good explanation of the idea of choosing 14, as the most appropriate period , based on a comparison between what is higher and what is lower.
Your answer to the third question was clear and successful.
The rest of the answers were good in their analysis and conclusions based on clear graphs.
Thanks again for your effort, and we look forward to reading your next work.
Sincerely,@kouba01
Thanks for the review prof. @kouba01
Looking forward to next week's class.
Interesting and clear information about Crypto Trading with Average True Range (ATR) Indicator.
Wish you more success My Friend in following Crypto Academy.
Thanks @tucsond
Enjoy a #Club75 bonus vote !
Amazing! 😀 Hail #club75
Hello users of steemitcryptoacademy,I am new here, can you please encourage me by upvoting my post followers of virajherath.
I love virajherath post,👍👍💓💓