TRADING USING WEDGE PATTERN - CRYPTO ACADEMY / S5W5- HOMEWORK POST FOR @sachin08
introduction
Hello everyone this week we learnt trading using wedge pattern. I find this approach to trading very insightful and unique it's not something I have come across in all my years of trading and for this I very grateful prof.
As proof of my understanding I will be attempting the assignment which was given.
(1). Explain Wedge Pattern in your own word.
answer
The wedge pattern is a trading technique which involves the use of use of support and resistance slanting lines , trading volumes as well price action in order to determine the direction in which price is going to.
This is a technique in trading which represents a consolidation period between the buyers and sellers.
It is shown with the present of two Slanting line with the price bouncing off both at least 5 times in total before the eventual break out at the contraction point( where the two lines are converging). At first, the candle bars are big representing high trading volume then slowly the candle bars reduce in size till they become small representing reduced trading volume, at the point where the candle bars are very small the price would be gearing up to explode outside the confines of the lines.
During the period of wedge formation buyers are sellers are neither in control of the market as the price keeps bouncing from the support to the resistance line.
It is a complex trading technique and not so difficult to spot in charts, if you are able to spot a wedge pattern on your chart , it is a strong buy or sell signal depending the kind of wedge which is spotted.
They are two types of wedges
Rising and falling wedges.
We will go into details about the types of wedges in the next question.
(2). Explain both types of Wedges and How to identify them in detail. (Screenshots required)
answer
As we have been thought, they are two types of wedges
• rising wedge
• falling wedge
Rising wedge
The rising wedge is a bullish reversal pattern and it usually forms after a period of upward price action.
It is a form of candle stick pattern which sees the price bouncing upward between two ascending lines the support and resistance. The top line serves as resistance while the bottom line serves as support.
The price goes back and front between the support and resistance in a continuous Battle of price action.
Eventually since it's a rising wedge the support gives way and the price falls.
How to identify rising wedge
- ascending lines
In a rising wedge the are two ascending lines which indicates that the price is rising. The two ascending lines are
- line 1 (resistance) the first line above serves as a resistance
- line 2 (support) the second line below serves as support
(2). Decreasing trading volume
The trading volume decreases progressively we notice that at first the trading volume is very high and slowly as price keeps bouncing between support and resistance line the trading volume keeps reducing.
(3). Bounces off both support and resistance
The price should bounce between the support and resistance line consecutively, this shows that neither the buyers nor the sellers are in control of the market.
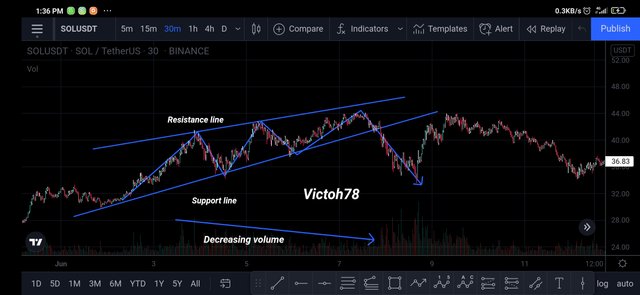
The image above is an example of a rising wedge
We are able to ascertain it is a rising wedge by following all the guide lines listed above.
• We can see the presence of two Ascending lines on both side of the price,
• The price is within the two lines and bouncing off both serving as support and resistance
• The trading volume which can be spotted below slowly declining
• The price breaking the support close to the meeting point of the two ascending lines.
falling wedge
The falling wedge is a sort of bearish reversal signal which occurs after the price has been on a downward price action, the price then consolidates bouncing off the support and resistance line and falling slowly before the eventual break of the resistance line .
The falling wedge consist of two descending slanting line with the price between them bouncing back and front. The top line is the resistance line and the bottom line is the support line.
Eventually the resistance line breaks and the price bounces up during a falling wedge pattern.
It Is the second of the two types of wedge
How to identify falling wedge
- Descending lines
In a falling wedge the are two descending lines which indicates that the price is falling. The two Descending lines are
- line 1 (resistance) the first line above serves as a resistance
- line 2 (support) the second line below serves as support
(2). Decreasing trading volume
The trading volume decreases progressively we notice that at first the trading volume is very high and slowly as price keeps bouncing between support and resistance line the trading volume keeps reducing.
(3). Bounces off both support and resistance
The price should bounce between the support and resistance line consecutively, this shows that neither the buyers nor the sellers are in control of the market.
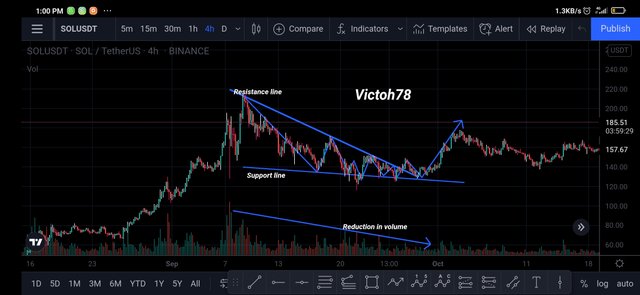
The image above is an example of a falling wedge
We are able to ascertain it is a falling wedge by following all the guide lines listed above.
• We can see the presence of two descending lines on both side of the price,
• The price is within the two lines and bouncing off both serving as support and resistance
• The trading volume which can be spotted below slowly declining
• The price breaking the resistance at the meeting point of the two Descending lines.
(3). Do the breakout of these Wedge Patterns produce False Signals sometimes? If yes, then Explain how to filter out these False signals.
answer
Yes false signals do occur!!!
Like any trading pattern the wedge pattern is not 100% accurate this is due to the fact the market is unpredictable and has thousands of participants who at times can be irrational when trading, hence making the market move in irrational patterns which can cause false signals and false breakouts.
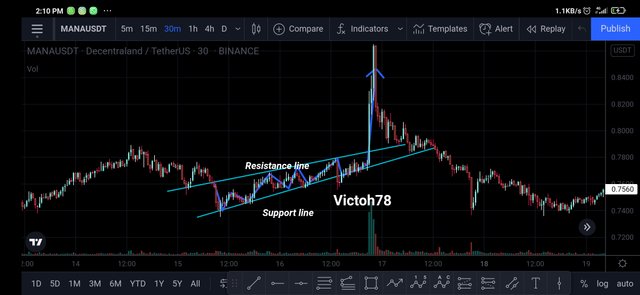
From the above we can see that the wedge trading technique is no exception and can produce false signals.
In the above setup we saw the rising wedge take shape. Normally it is expected that when we get a rising wedge formation the support would give way leading to price fall. But the reserves was the case leading to the price going up. Taking this trade would have resulted in a loss
How to filter false signals
They are various way in which we can avoid fake signals, when using the wedge pattern, Some of the steps are as follows
• Always ensure the price bounces off the support and resistance at least 5 time if possible more this reassures us that the wedge signal is strong.
• Always note that the volume is decreasing as the price bounces between the support and resistance, this further ensures us that the wedge signal is solid.
• Only take breakout that occurs at the point where the support and resistance line are closest. Any other breakout which may occur would be misleading or a fakeout.
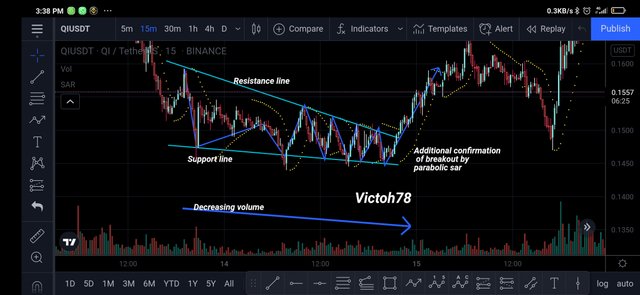
• Having taken all this steps and still in need for extra confirmation or prevention from entering the wrong trade you can add other indicators such as moving average, MACD, Parabolic sar and so on.
Adding this other indicators would help to fine tune your entry and prevent you from entering a trade too soon and from false entries.
From the chart above we can see that using the wedge pattern in combination with indicators such as parabolic sar helps to confirm or prevent false signal . In the example above the parabolic sar was instrumental in in giving the correct signal.
note the price must bounce between support and resistance sequencially. Without the price bouncing off both sequencially it doesn't indicate that a wedge formation is being formed or that the wedge formation being formed is weak hence it might not give the desired result.
(4). Show full trade setup using this pattern for both types of Wedges.( Entry Point, Take Profit, Stop Loss, Breakout)
answer
Rising wedge trade setup
Knowing the theoretical aspects of anything trading pattern is essential but it is imperative that we understand how to do so practically.
In executing a rising wedge trade we must be really patients to let the pattern form and for the price to reach the contractionary point where support and resistance line is closest before we can enter the trade. Having studied the market for days I present to you the trading set up for a rising wedge.
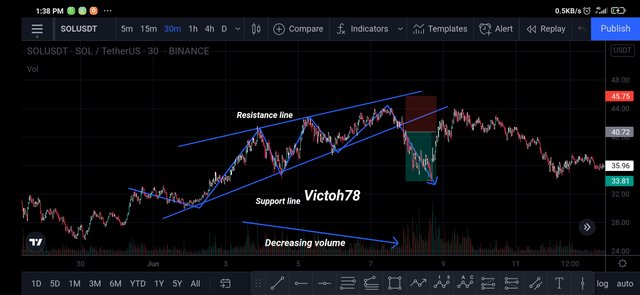
trade set up
Step 1
Draw our wedge : drawing a good wedge is imperative to any good trade . To draw the wedge we must first identify a situation where by the price is consolidating after an upward movement.
Step 2
Ascertain the price is bouncing between the support and resistance lines multiple times
Step 3
Having taken step one and step two, next I waited for the price to get close to the point where the support and resistance are closest.(at this point would the breakup out be acceptable)
Step 4
When I noticed the price has broken the support, I waited for the next candle to close this gives me added confidence that the breakout has occured
Step 5
Observed that the trading volume was reducing as the piece was moving closer to the point where support and resistance are closest.
Step 6
I enter the trade, after the next candle closed below the previous open.
Set my stop loss right below the resistance line
Set my stop loss for 1: 2.5 reward to risk.
Summary for the trade
Having followed all the rules to the letter we can see that the trade was a success and we hit our take profit. As indicated in the diagram above.
Falling wedge trade setup
The falling wedge setup is a bearish reversal signal which indicated that a downtrend has come to and end. Trading a reversal signal is always tricky, any wrong signal can see us trading against the flow of the market and this would be very bad.
Luckily we are knowledgeable to us the falling wedge pattern. Using the falling wedge pattern is as follows.
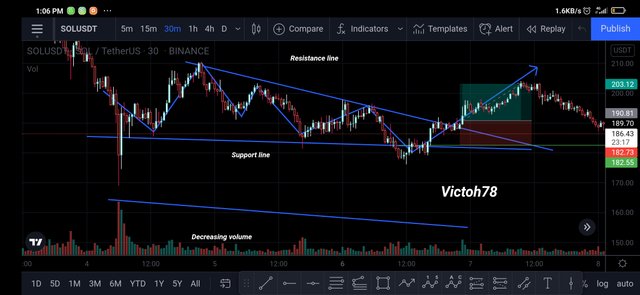
trade set up
Step 1
Draw our wedge : drawing a good wedge is imperative to any good trade . To draw the wedge we must first identify a situation where by the price is consolidating after an upward movement.
Step 2
Ascertain the price is bouncing between the support and resistance lines multiple times
Step 3
Having taken step one and step two next I waited for the price to get close to the point where the support and resistance are closest.
Step 4
When I noticed the price has broken the resistance, I waited for the next candle to close bullish, this gives me added confidence that the breakout has occured.
Step 5
Observed that the trading volume was reducing as the price was moving closer to the point where support and resistance meet
Step 6
I enter the trade, after the next candle closed above the previous open.
Set my stop loss right above the support line
Set my stop loss for 1:1.5 reward to risk.
Summary for the trade
Having followed all the rules to the letter we can see that the trade was a success and we hit our take profit. As indicated in the diagram above.
All screenshots are taken on my device from trading view and edited by me
Conclusion
Having gone through the assignment questions and answers them I can conclusively say that the wedge trading technique is a fascinating and very profitable when applied well and following all the rules.
The wedge trading technique would provide the expected returns .
I am truely grateful to my professor for teaching me this trading technique i hope you find the answers I have rendered suitable to adequate. Thank you.


