Steemit Crypto Academy Season 5 Week 2 [Beginner's Course] - Recognizing Simple Patterns in Trading||Homework Post for @sachin08

introduction
Hey crypto academy it's your money Hungry boy victoh.
Just as, this is professor SACHIN08 first lecture this would also be my very first assignment in this community. Having gone through the lecture I really did enjoy alot and learn alot as well and as such I would love to attempt the assignment questions which were given to prove my understanding of what I have been thought.

Question 1
answer
From the lecture received, I have come to the conclusion that triangles in respect to trading represents a period in which price consolidates between the resistance and the support region.
The triangles represents a point where the price is below the resistance area and above the support area. The price is within both of this area . It is the movement of price within this area which forms the various forms of triangle we would be discussing below. During the formation of a triangle we tend to see that the price respect both the support and resistance area, that it until it gets to the edge of the triangle at which point the price breaks the support or the resistance and the trend picks up.
They are three forms of triangle to represent either bullish and bear trend and a third triangle which is neutral.
Ascending (bullish) triangle
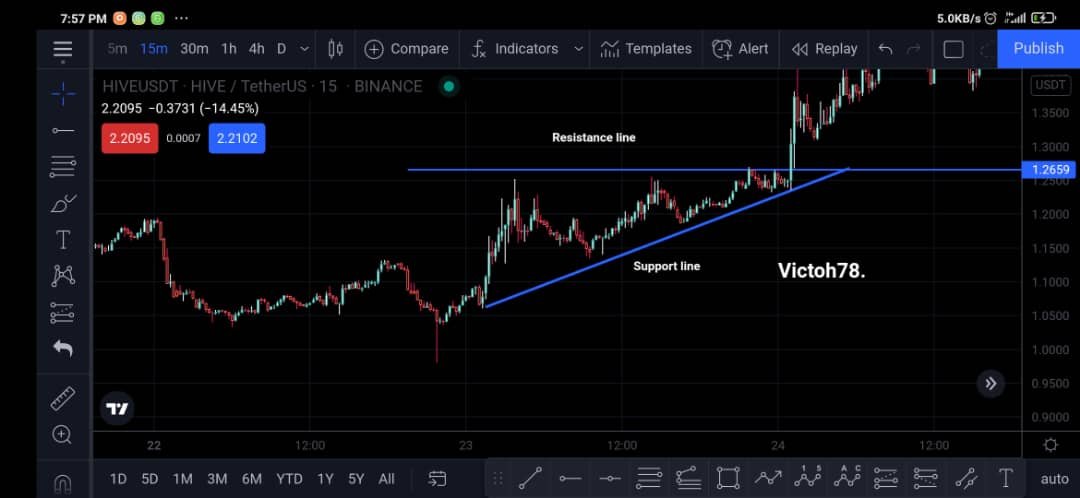
image gotten from my trading view anyalsis of hive/usdt chart
At first glance looking at the diagram above, we might not always be able to see the triangle formed but with the aid of the support and resistance line we can better see how the price bounces within them, at first going up very high and down very high but slowly reduces as the angle gets smaller, it keeps on reducing till it gets to the angled point at which point it explodes upward hence the term break out.
The ascending triangle is a bullish signal in the sense that it shows the price action that leads up to a bullish break out.
Structure of an ascending triangle.
A horizontal resistance line
The ascending triangle has a horizontal resistance like this is the highest price point in which the price reached. After reaching this point the price trends to retrace a little for the market to rest. The retracement is such that the price doesn't go all the way down..but just a little then goes back up test the price. The resistance line is straight and doesn't change, indicating that once the price breaks above there is likely to be a huge upward movement.
slanting support line
The support line in the ascending triangle is ascending in nature hence the name ascending triangle. The slanting line indicates that the prices is making lower lows, and that the price is slowly rising.
The price would keep bouncing of the same resistance line but almost never the same support line.
The support line keeps ascending up until the point where the support and resistance line join. At that point the price having respected both lines would break above the resistance line indicating a huge upward move.
Descending (bearish) Triangle

image gotten from my tradingview anyalsis of USD/JPY chart
The descending triangle is a bearish signal..it's formation on the chart indicates that there is likely to a bearish break out.
The descending triangle can be easily spot during when the prices have been falling. When the prices fall for a while there is always a consolidation period in which the market rest for a bit before further decline.
This period of resting is usually what constitutes the triangles and in this case the descending triangle.
At first glance the candle sticks are big going all the way up and down then slowly the size of the candles declines with the price edge towards the angle of the triangle ( the point where the support and resistance meet.) At the edge of the triangle the support line which the price has been testing for a while gets so weak and the price is able to break it easily. The break is followed by a serious selling pressure which leads to price falling sharply.
From the chart above we can see that the price respected the support up until it got very close to the angle of the triangle and at this point once it broke below,a huge price fall followed.
The ascending triangle is a good signal which indicates when the price is going to fall.
Structure of the descending triangle
Horizontal support line
The ascending triangle has a straight support line which does not change but rather remains fairly constant . The line represents the point which when broken would lead to an aggressive sell.
The straight line is usually at the lowest price in the last period. At which point the price began to rise but stills comes to test it.
The support line is often tested repeatedly till it is broken around the angle of the triangle.
Slanting resistance line
The resistance line in the descending triangle is always sloping downward this is what give it its name descending triangle. The reason as to why the triangle slopes downward is as a result of the fact that the price never test the same resistance point it keeps making new resistance points which are lower than the previous point.
These points can then be joined together to get a slanting line which indicates future areas in which the price would get rejected at up until the point where the resistance line meets the support line at which point the support line breaks .
The slanting resistance line indicates that the price is making lower highs and slowly falling.
Symmetrical Triangle

image gotten from my tradingview anyalsis of AUD/CHF chart
This form of triangle offer a 50:50 chance of either an upward or downward trend. It occurs in a situation where by the prices are neither strongly trending up or down but rather a little of both.
A systematic triangle is very difficult to trade as any wrong anyalsis could see the market swing heavily against you resulting in the loss of money. In the chart above, the price favoured an upward break out as the resistance line was the weaker of the two.
The symmetrical triangle has both the support and resistance line. Edging towards the angle(the point where they both meet) It is very different from the two types of triangles we discussed.
Structure of the triangle
The symmetrical triangle is made of
• Slanting resistance line
• Slanting support line
• Both edge towards the angle
• indicates 50:50 chance of upward or downward break out
Question 2
Answer
Yess!!!we can use some indicators along with the triangle patterns.
We can use indicators along with triangle patterns this is because indicators gives us further confirmation that we are trading in the right direction. They serve as some sort of additional confirmation to our triangle pattern.
Things to note when adding indicators
• Add only indicators that don't cluster your chart
This is because they are some indicators such ichimoku, bolinger,zigzag that when added to chat obstructs your view of seeing the candlestick pattern form. They make your chart cluster and difficult to to understand
• don't use too many indicators
Using too many indicators would only serve to confuse any trader as different indicators serve different purpose. Going along to add moving average, average true range , average directional movement , supper trend , orderblock. Would only confuse any trade as this different indicators all indicates different things and don't go together.
• use indicators that compliment your trading style
It is important to only use an Indicator that compliment the trading style. Indicators like parabolic sar ,volume or moving average complements the triangle patterns so should be encouraged
• the more indicator the later your entry
When they are so many indicators it makes it difficult to enter trades as you have to wait for alot of confirmation signals. You might be waiting and the breakout would have occured and you would miss the the trade. You can use the right indicators but too many right indicators would delay your entry. Most times it is better to use 1 or 2 indicators in addition to your triangle pattern this would better filter our falser moves and give you early entry into the trade.
Indicators that could be added to the triangle
They are alot of indicators that could be added to the triangle pattern which would further improve our trading experience, such indicators include volume , parabolic sar , moving average, rsi , scholastic indicator and so on.
parabolic sar + triangle pattern

image gotten from trading view||trading with parabolic sar
The parabolic sar indicator is a forecasting indicator in the sense that it indicates the future directions of the price based on passed movements .
When trading the triangle as seen above the parabolic sar seems to give an extra confident that the price is going to break above.
When the green dots are below the price it indicates price is going up and when it is above the price it indicates that prices are going down.
When trading parabolic sar + triangle pattern it is best to wait until one or two dots appear in the direction of your anyalsis. From my anyalsis above two dots formed below the price which further confirmed with ascending triangle that the price was going to break out upward and break out did it .
Parabolic SARS goes well with the triangle pattern as such.
volume + triangle pattern

image gotten from trading view ||Trading with volume
Another Indicator you can combine with the triangle pattern is the volume indicator. Unlike the parabolic sar the volume indicator in combination with the triangle gives an idea when the possible break out might occur this is due to the fact that most times the price doesn't get all the way to the angle( meeting point between resistance and support area) sometimes the break out might occur when the price is still in the middle of the flag and we would have missed it but with the volume indicator it informs us that break out only occurs when the volume Increases and as the volume indicator still remains low. The break out is likely not to happen but when the sizes of the volume bars starts increasing it tells the trader that the breakout is about to happen.
This helps the trader to enter his trades early and not miss out on the big moves. Also with volume we get an indication of who is in control of the market . The green bars below indicates that the buyers are in control of the market hence our buy position is valid.
volume + rsi + triangle pattern
This is more of a complex trading technique that involves the use of more than 1 indicator before entering the market.
In this as we would be combining the rsi and volume in conjunction with the triangles pattern. This is because at times one indicator may give a wrong signal but with two indicator giving a buy signal the chances of it being wrong is significantly reduced.from the chart below BTC/USD we can see that the price is at the edge of the symmetric triangle and at the same time neither the volume nor the rsi is giving any significant information as to the direction of the price.
The rsi is neither at over bought or over sold it is staying within the neutral region on the other hand the volume bars are a mixture or small red and green bars indicating that neither the buyers nor the sellers are in control of the market and that no break out is likely to occur until one takes control of the market.
With the help of multiple indicators it helps tell the trader that it is not every market that is tradable and sometimes we should wait before entering the market

image gotten from trading view ||Triangle pattern with rsi and volume
They are so many other combinations out there that would
work Combination with candlestick pattern also depends on the trader they are traders that are comfortable with ichimoku + triangle patterns and they are also traders who are not. But all in all the combination of indicators with triangles are acceptable and possible
Question 3
Answer
Flags in trading this is form of candle stick pattern which looks like a flag. It occur when there is a sharp movement followed by a point of consolidation. The sharp movement takes the form of the pole while the consolidation period takes the form of the flag🚩
The flag could be straight representing a bullish flag or inverted representing a bearish flag.
Flags are strong indicators of the direction of trend.
A bullish flag often shows a strong bullish trend and Futher buying is supported on the other hand a bearish flag indicates a strong bearish trend and further selling is supported.
Bullish flag.

image gotten from trading view
As seen above the price initially took a huge upward movement then consolidated.
This consolidation is what led to the formation of the triangle, the triangle when added to the pole which is the initial sharp upward movement gives us the flag pattern which shows a strong upward movement and indicates that we should be on a buy in this trade.
Bearish flag

image gotten from trading view
This flag first starts with a sharp fall downward followed price movements followed by a consolidation period which forms the triangles. When we join the triangle with pole the flag becomes very visible the bearish flag indicates a strong selling pressure and is a selling (bullish ) signal, this signal indicates that we should be on a sell in this market .
Question 4
Answer
Trade set up for am ascending triangle hive/usdt
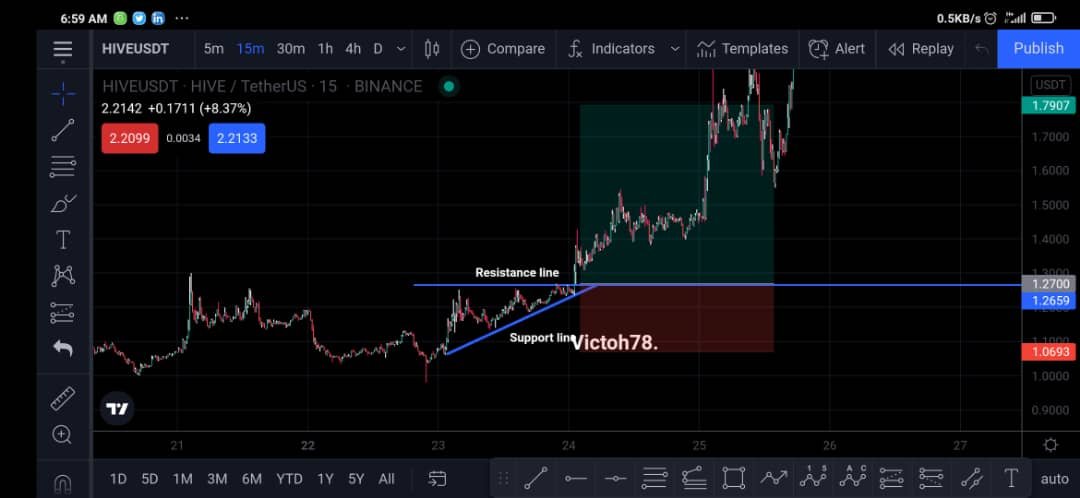
image gotten from trading view||ascending triangle trading
From the diagram above we can see that when trading an ascending triangle we are looking for buying opportunities we don't want to be sell when we have an ascending triangle pattern as this could lead to losses.
From the diagram above we can see that our stop loss should be set below the start of the support so as to prevent us from being stopped out of the trade too early and our stop loss should not be soo far down as this would cause is to include loss.
Lastly from the chart above we can see that we should always set our entry point at the point where the price is close to the angle (where support and resistance meet)
It is important that we should always apply proper risk management when trading the ascending triangle .
Trading setup for symmetric triangle BTC/usdt

image gotten from trading view
The symmetric triangle is a 50:50 trading pattern which indicates that the price is about to break up above the resistance line or break below the support line. When this break occurs it usually very steep or sharp pending the direction and alot of money could be made or loss rather.
Since it is 50:50 pattern it has this sense of uncertainty as traders trading this pattern could potentially make serve loses or massive gains. It is always best to trade this pattern with caution as it is high risk high returns
steps to trade Symmetric triangle pattern
• step 1 identify the trend of the market
• step 2 draw your symmetric triangle
• step 3 which area is tested more
• step 4 ascertain the position of the price within the triangle
• step 5 wait for the price to reach the angle
• step 6 set buy or sell order
• Step 7 set your stop loss and take profit
Trading setup for bearish flag xrp/usdt
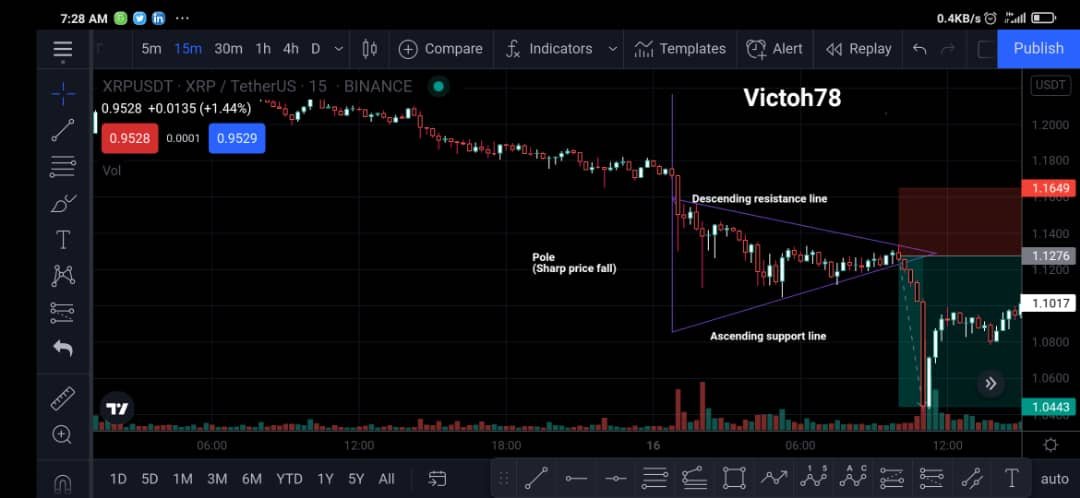
image gotten from trading view
Bearish flag this pattern indicates that the market is downward sloping and that sellers are in control of the market trading the bearish can be very simple and efficient as we are trying to trade. In the direction of the follow
Steps to take while reading bearish flag
• identify the flag
• note the streght of the trend
• draw the support and resistance line
• note the position of the price in relation to the flag
• wait patiently for the price at the angle
• set your sell order when prices starts converging towards the angle
• set your stop loss above the resistance line horizontally
• set your take profit
Following the steps above
would be easy to take profits under the right condition a deviation from this could result in either getting stopped out too early or entering the trade too late the trade should be entered at the point where price starts to converge towards the support and resistance line cause at this point the break out is imminent and obtainable entering the trade when the price is still within the middle of the flag could. Results in fake outs and lead to loss of funds
conclusion
It's always fun acquiring new knowledge , I thought I knew alot about trading but during the course of this assignment I realized trading is more complex which entails alot of research. I would like to give a special thanks to prof SACHIN08 for this beautiful course.
I hope I have been able to answer all the questions to your taste