See[Candlestick patterns] - Steemit Crypto Academy Season 5 - Homework Post for Task 10||by @victoh78

introduction
Hello everybody it's your money hungry boy victoh. After being on steemit for a 3months, I have finally gotten the requirements for joining crypto academy which is (50rp and 150sp). This would be my first post in this community I will rendering answers to the assignments given by @reminiscence01 on candle stick patterns. Am really optimistic about all I have learnt so far and I am hoping you all find value in my work below. Thank you.

a) Explain the Japanese candlestick chart? (Original screenshot required).b) In your own words, explain why the Japanese candlestick chart is the most widely used in the financial market. c) Describe a bullish and bearish candle. Also, explain their anatomy. (Original screenshot required)
Question 1a
What are Japanese candlestick chart?
Japanese candlestick this is primarily a representation of the interaction between the buying and the selling prices within a given period of time , the candle stick is a tool of technical analysis, which is used to show the price action of various commodities be it stocks crypto, Forex etc. Candlestick is the most common price action chart in use today, it was developed by the Japanese and used for the calculation of rice prices in the early 18th century.
They are two types of candle sticks.

This candle stick indicate that sellers are in control of the the market

This indicates that the buyers are in control of the market
Both bearish and bullish candles tell an entirely different story. Though they look alike only varying majorly in colour. The candle stick pattern may look so simple but by looking at it, we are able to forecast the direction of the prices in the near future.
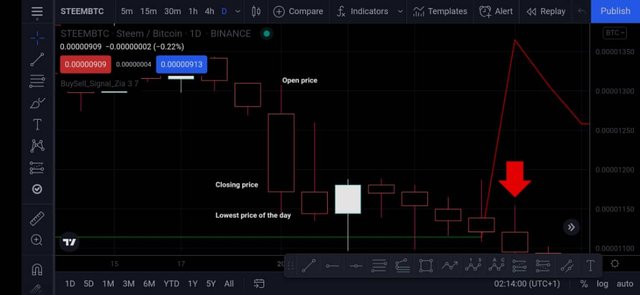
By looking at a single candle we are able to tell the opening price or the market the highest price of the market the lowest price of the market and the closing price of the market all this are necessary for price forecast. with this information given it is then able to have a better understanding of what is going on in the market.
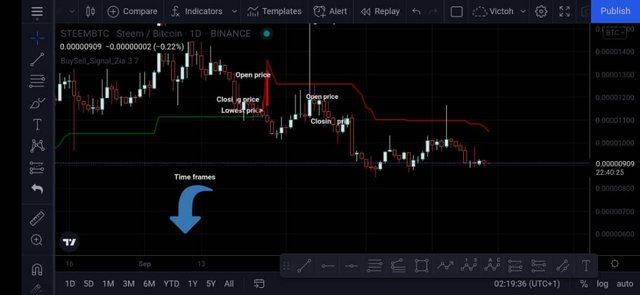
It is worth noting that candlestick are printed on the chart based on time frames. This simply means that it could set it so each candle represent 1 hour of price action 30 minutes or 15 minutes and so on.
This is very important because it enables us to understand what is going on in the market at a given period of time the time frame could go as small as 1 minute and as large as 5yrs as seen on the diagram above.
Question 1b
In your words why is candle to the most important
From my experience why I would say candle stick is the most important price chart this is because it gives the most details and shows a great deal of what is going on in the market in comparison to other forms of price chart.
The line chart only shows the present closing prices it doesn't give much details as to the previous opening prices it is often difficult to conduct technical analysis with just closing prices.
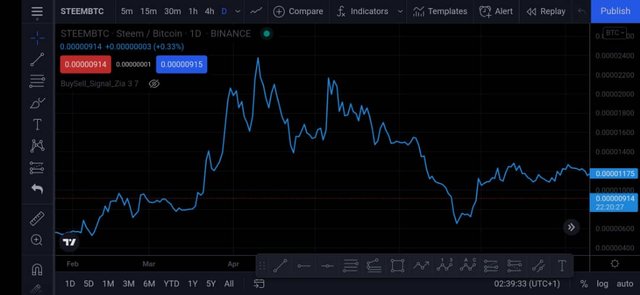
The kagi chart same as the line chart doesn't show in details the highest point or lowest point line candle sticks, it just gives you the closing prices in form of connecting lines.

Hence looking at this we find out that, the information found on the candle stick is peculiar to it alone and that is why it is the most used price chart for analysing prices.
Candlestick patterns are so easy to understand that is why when you open a new meta4 account , trading view or binance prices are usually expressed in candlestick form.
And this is why I believe candle stick pattern is the most efficient form of price chart.
Question 1c
Describing bullish and bearish candle
When we talk about candlestick they are two types of candle stick that is the bullish and the bearish candle stick. Each of this two give a certain information about the happenings in the market though they look similar but vary to a vast extent and this I would be Explaining below with thier respective anatomy.
bullish candle stick
The bullish candle stick this indicates that the buyers are in control of the market. The term bulls in relationship to candle stick tells us that the price was down but the bulls where able to push it up. When we say the market is bullish it means the market is good to buy.
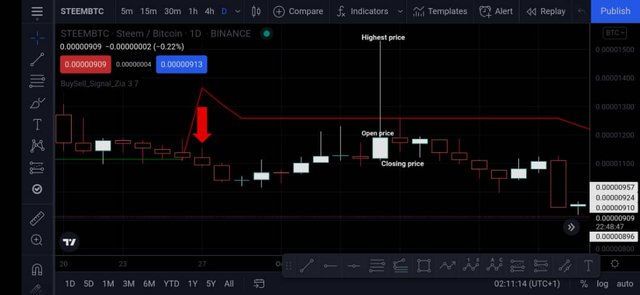
From the candlestick above we can tell it is a bullish candle from 2 key things in relation to one another. Opening price and closing price
opening price
This is the price at which the candle stick opened and how we can tell it's a bullish candle is that the price closed above the opening price.
closing price
This is the price at which the candle stick closed and how we can tell it's a bullish candle is that it closed above the opening price.
So in essence when the price closed above the opening price it is a bullish candle.
This is the easiest way to determine if it's a bullish candle.
Of course they are other ways to determine the nature of the candle stick patterns.
body of the candle
Green or white candles usually indicate a bullish candle. Why this is not generally accepted is due to the fact that the colours of candles could be changed to suit the traders perspective. But on average most trades and in most chart a green or white is used to indicate bullish candles.
bearish candlestick
This indicates that's the sellers are in control of the market momentarily. The term bear in relation to candlestick tells us that the price was up but the bears dragged the price all the way till the close of the candle. The bears are often called the sellers. When we say the market is bearish it means it's good for a sell.
From the candle stick above we could tell it is a bearish candlestick from the relationship between the opening and closing price.
opening price.
This is the price at which the candlestick opened. From the diagram above it could be seen that though the price opened high it eventually closed low this indicates that this is a bearish candlestick as the bears were able to drag price all the way down.
closing price
This is the price at the close of the candlestick. From the diagram above we can see that price closed below the opening and this in essence signifies that the price was dragged down by the bears during the duration of the candle stick.
body of the candle
Typically the body of a bearish candlestick is usually red or black. The body is the difference between the opening or and the closing price The area is the body. Though this is a good indicator of bullish or bearish candles the colours of candles can be adjusted due to the traders choice hence they are not all that reliable. On average most charts would show bullish candles as red or black
conclusion
Having gotten to this point I hope I have been able to exhaustively explain candle stick to even the layman and I have answered the questions presented to the best of my capabilities.
I would like to thank my teachers for this very beautiful course which has further deepened my knowledge on candlestick, I look forward to other equally challenging assignments such as this, thank you
Ps. All images except the first are screenshots from my device. These screenshot were taken from trading view and have been used to buttress my points and Better diagrammatically explain the assignment which was given to me.
#club75 😀