Perfect Entry Strategy using Stochastic Oscillator + 200 Simple Moving Average - CryptoAcademy - Dynamic Beginner Course - S5W3 Homework post for @lenonmc21

Introduction
Hello everyone , this week we were taught perfect entry strategy by prof lemonmc21, it was a very fascinating lecture as I never knew such a trading pattern existed I was soo thrilled to have discovered this and I am ever grateful to my professor for the knowledge ,he has impacted on me.
Below I would be attempting the questions he presented to us , to show my understanding of the lecture we were given hope you find value in my work

Question 1
Say in your own words what you understand about the Perfect Entry Strategy (Put at least 2 examples on crypto assets)?
answer
Perfect entry strategy as we have been taught in this week's lecture is an entry strategy in which we use a combination of three indicators namely scholastic , candle pattern and 200MA in other to fine tune our entrance so as to enter the trade at a very close to perfect point
The perfect entry strategy is not a standalone sort of strategy it requires the combination of of different indicators which are paramount to the success of the strategy we can't use 2 out of the 3 indicators perhaps for want of time as this would go against the strategy and lead to wrong entry position. The strategy is such that each of the three indicators have a very crucial role to play in the development of the strategy.
• The 200MA
it serves as a dynamic support and resistance.
When the price is going up the 200MA is below the price serving as support to push the price up when it is going down and when the price is going down the 200MA is above the price reserving as resistance.
• The scholastic indicator
This indicator when used in this strategy tells us when the price is at an over bought or over sold region. This is essential as it also indicates the strength of the trend when it is approaching the 200MA a strong trend would likely break the dynamic support or resistance of the 200MA while a weak trend is more likely to be rejected.
• The candle pattern
This plays an important role in the strategy it indicates to us as to the nature of the price while it is approaching the 200MA the candle pattern that tells us whether the price is decisive or not . A shot candle with long wicks indicates that the price is indecisive and that it would likely not break the 200MA while a long candle with small wicks tells us the price is decisive and that it is likely to break the 200MA
Perfect entry with crypto
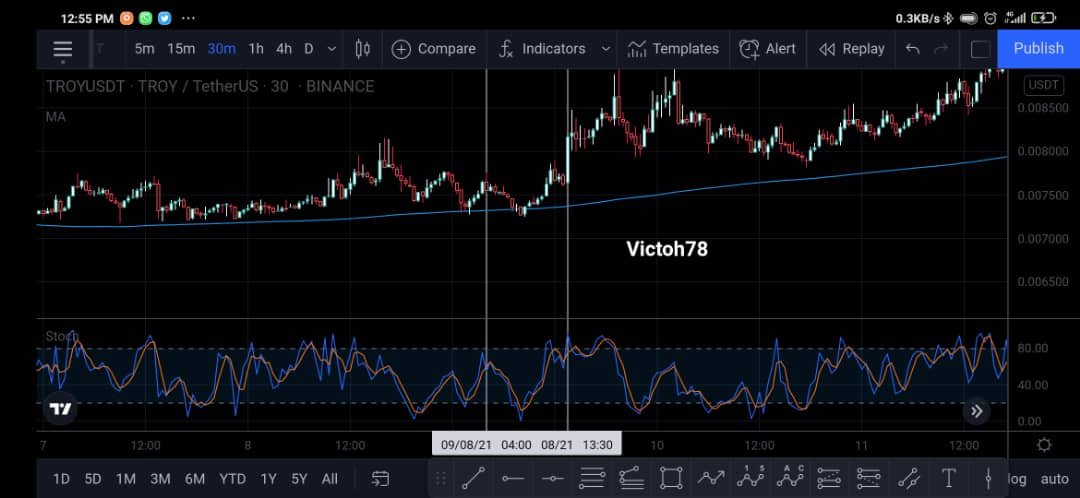
troy/usdt anaylsis gotten from tradingview
From the analysis above we can see the perfect entry strategy play out nicely in the troy/usdt chart . As we can see the scholastic indicator was at over bought below the 20 point region while the price was at the 200MA average. Additional we look at the the candle stick pattern that formed at the point closest to the 200MA, it is a short candle stick with long wicks indicating that the bullish trend is still strong and the. 200MA would serve as a dynamic support.

xrp/usdt anyalsis gotten from tradingview
From. The chart above we can see the perfect strategy play out nicely this time around in a bearish market. Where the 200ma serves as a dynamic resistance. Looking at the chart above we can see at the prices closes in on the 200MA the scholastic Indicator gets to the oversold region just above 80. And also the candle stick that forms near the 200MA line is a short candle with long wick indicating weakness of the trend.
Question 2
Explain in your own words what candlestick pattern we should expect to execute a market entry using the Perfect Entry Strategy.
answer
In order to execute the perfect entry strategy they exist a particular type of candle in which we must look out for in order to reaffirm our believe that the trend is about to change or not. This candlestick pattern is very important as without it the other two indicators are invalid.
Candle stick patterns are real life price action movements represented in the form of candle sticks.
As we well know At this point the perfect entry strategy Is an entry signal hence at the point where the price gets to the 200MA we would be looking for a short candle with long wick to represent that the trend is weak.

Image gotten from
As seen above candle sticks which are short and have long wick are usually weak trend indicator they are indecisive in nature. The fact that they are Indecisive is what makes it a perfect trend reversal signal
this is due to the fact that the scholastic indicator which is already at extremes and the 200MA which serves as a dynamic support or resistance helps make the candle stick decision on which direction to go. A short candle stick with long wick is easily swayed in the direction of the other two indicators.
On the other hand a long candle with little or no wick indicates that the trend is strong and has a clear direction.
When such candles are formed we should not take the trade.
Question 3
Explain the trade entry and exit criteria for buy and sell positions in
any cryptocurrency of your choice (Share your own screenshots)
answer
Before entering any trade using the perfect entry strategy they are a variety of things to look out in other to give us that confidence we are looking for and also that accuracy of trading. This look out signs are very important before we can use the perfect entry strategy and they are as follows
• the scholastic indicator must be at either extremes this being 0-20 or 80-100

scjolastic indicator gotten from trading view
from the above we can see that at 0-20 the price is over sold
from the above we can see that 80-100 the price is over bought.
• A candle with small body and long wick has to form at or close to the 200MA.
This candle indicates that the trend is weak and indecisive. Hence the trend reversal is very likely
• the price must be at or close to the 200MA
the 200MA serves as a sort of dynamic support or resistance for price. Hence the need for price to visit this region in other for us to observe how it interacts with other indicators such as the scholastic and candle stick pattern.
• lastly all three events must be occuring simultaneously for the perfect entry strategy without all three being complete we would have to wait.
Take for example if we have scholastic and small candle and big weak without the price getting to the 200MA we would have to abandon the trade, as all the factors required for the strategy isnt complete.
With this strategy we can't use 2 and not use the other. We have to use all three together in other to strengthen our decision to enter the trend and our assurance that the trend has reserved or not.
Having met all three criteria the perfect entry strategy would take the following shape
Bullish market

btc/usdt gotten from tradingview
Bearish market

mana/usdt gotten from tradingview
We can see that in the above charts the scholastic Indicator was at overbought and over sold respectively and also we waited for the price to get to the 200ma and finally waited to see what sort of candle formed at the 200ma for us to decide that it is a perfect entry status and we can see that having met all criteas if we were to take these trades they would have been a winning trade hence the genius of the perfect entry strategy.
Question 4
Trade 2 demo account trades using the “Perfect Entry” strategy for both a “Bullish” and “Bearish” scenario. Please use a shorter period of time to execute your entries. Important you must run your entries in a demo account to be properly evaluated
answer
For the practical I would be showing my trade of two crypto pairs one bearish and one bullish to show the perfect entry strategy works on both market
Bearish market

Sand/usdt gotten from tradingview
The above is a live trade which I opened on tracing view for the Sand usdt
steps taken to execute the trade
•first we observed the trend of the market. Which was a down trend
• waited for the price to get up to the 200ma
• at this point we noticed the scholastic indicator was at the over bought region
• lastly we waited to see what candle forms when the price gets close to the 200ma
• since the three criteria were met I then went on to open the trade risking a 1:5 reward.
bullish market

btc/usdt gotten from tradingview
The above is a past trade which I observed could be taken on the chart. This is due to the fact that the market has been bearish for a while hence difficulty in finding bullish setup for the perfect entry.
step taken to execute the trade
• note the trend of the market
We observed the market is in a bullish trend so look for the 209ma under the price
• we wait for the price to get to the 200ma to test it for support
• we see what candle forms when the price gets to the 200ma point
• from the chart above we can see variety of short bullish and bearish candle with long wick hence the uptrend is still solid
• we open a buy position in the market
• we set stop loss just below
• we set take profit on a 1:3
note: both trades are taken on short time period 15 mins

conclusion
Having reached this point I would like to thank the entire team of crypto academy for providing this platform so we can better enhance our knowledge of all things related to crypto.
It has really been an interesting assignment and I look forward to future assignments from you professor I hope you find my work good enough to your taste as I have put in alot of research and effort into this thank you.