[Confluence Trading] - Crypto Academy / S5W6- Homework Post for @reminiscence01
Introduction
Compliments of the season, how is everyone doing and how are we going about this festive period.
This week we were thaught confluence trading technique, which I must say is very excellent, it is capable of making the difference between a good trader and an excellent trader.
The lecture was thought by prof reminiscence01 and it was titled confluence trading.
As proof of my understanding I will be attempting the assignment which was given.

(1)Explain Confluence trading. Explain how a trade setup can be enhanced using confluence trading
answer
Brief history.
As we all know they are so many trading patterns and indicators in which traders use to anayalse the market to make calculated forecast on price movement.
Over time it became apparently that though this various trading techniques and indicators though works well individually they do not work all the time hence false signals and misgivings, there was need to join multiple trading techniques and patterns for better confirmation and better entry point when making trades.
What is confluence: This is a situation where by a number of factors are set up together in such a way that they all point towards one direction. Hence in relation to trading it can be defined below as.
What is Confluence trading: this is a form of trading technique which incorporates multiple trading indicators for better technical analysis of price movement. Confluence trading is the symphony of indicators which can be combined for a more accurate price forecast.
It is observed that some times various indicators can deliver false signals due to the unpredictability of the market, but with the help of additional indicators we are able to filter out this wrong signals.
Confluence in trading occurs when two, three or more signals are in allignment giving the trader multiple confirmation that the price is going in a certian direction.
Sample
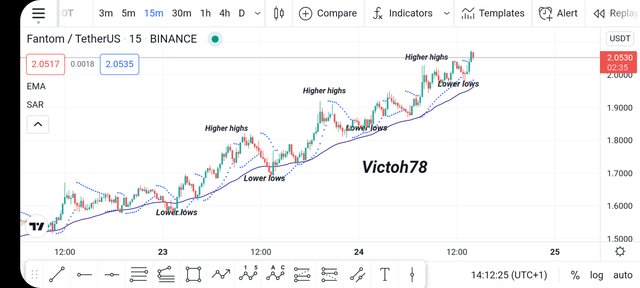
fathom/usdt|| gotten from trading view
The chart above is an illustration of confluence trading,
We can see various signals all indicating towards the buying direction.
From the charts we can see the following signals
1). 21 ema
The price is above the 21 ema indicating that it is an uptrend. We notice that's the 21ema serves as dynamic support. Which indicates an upward trend
2). Market structure
We observe that the market structure hasn't been broken and the price has been making consistent higher highs and lower lows indicating the upward trend is still going.
3). Parabolic sar
We can also observe that the blue dots are under the price which when using parabolic sar indicates that the price is going up.
Summary
From observing the charts above we can see that the indicators are in all in confluence and pointing towards the buying side.
Hence as a trader, having anayalsed the charts above we would go in a buy in this trade with confidence.
This is a good example of confluence trading as it inculprates several factors before the final investment decision was made
(2)Explain the importance of confluence trading in the crypto market
answer
Importance of confluence trading
Having understood what confluence trading it then becomes easy to understand why it is necessary to apply confluence trading when dealing with crypto assets .
Some importance of Confluence trading are as follows.
Builds confidence: when multiple indicators are at confluence and pointing towards one direction it further builds the traders confidence in himself and his anayalses. It prevents the trader from second guessing himself.
Better entry points: using confluence trading, we are able to better ascertain trend reversals and trend continuations, with the aid of two or three signals for confirmation before entry any trade.
While using Confluence technique we always try to enter trades at the point where multiple indicators are in sync hence we tend to enter trades at the right price, rather than too early or too late.Avoid fake out: fake out occurs when an indicator or candle stick pattern gives misleading siganls.
But with the combination of various indicators when using the confluence technique it helps prevent the mis giving that could arise.
This is because we do not rely on a single indicators before entering a trade but on multiple indicators.
While using confluence trading we could use rsi, scholastic oscillator, volume e.t.c.Prevents loss: proper usage of this technique prevents traders from entering positions they ought not to have entered. This is so because traders becomes patient and realize that onces he can't get two or three confirmation on his anayalses then he ought not trade that market as doing so would be wishing thinking.
consistence : it helps trader to become consistence in their trading. When traders apply this technique continuously and rightly we tend to make make more win-ing trades than losing trades.
(3)Explain 2-level and 3-level confirmation confluence trading using any crypto chart.
answer
2-level confirmation
Two level confirmation is a form of confluence trading where by we are looking for two indicators which allign in a direction which allows us to make forcast on the direction of price movement.
When using two level confirmation it is not enough for the price to be trending in a direction we have to also look for second confirmation before we can enter such trade, by so doing we are building confidence in our trade and preventing rash decision making.
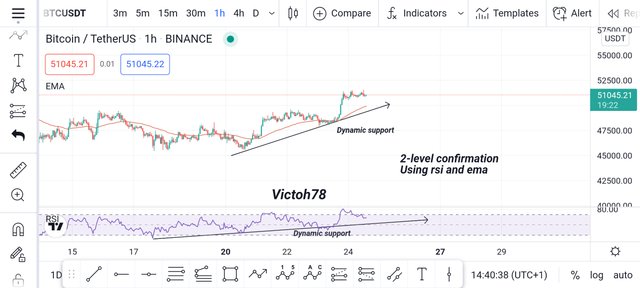
btc/usdt||trading view
From the chart above we can see the presence of two indicators signaling that the market is bullish.
Looking closely we can see that the rsi and the ema
With the aid of the trend line it then becomes obvious that the rsi has been trending upward that alone cannot signal us to buy into this market as the rsi is not at the over sold region (<30) hence if we were looking at this trade with only the rsi we would probably not take the trade or enter too hastily.
When EMA is added into the chart we can see a clearer picture of what is going on.
The price is above the 21EMA which has been serving as adynamic support, pushing price up.
With this second confirmation we are able to ascertain that the price is going upward and that the price is in an upward trend.
3-level confirmation
Three level confirmation is a form of confluence trading where we are looking for theee indicators to allign to give confirmation as to whether to buy or sell.
While using the confluence trading technique various indicators and candle stick patterns can be combined such as parabolic sar + moving average + candle stick pattern or Bollinger + vwap + candle stick pattern.
In essences the use of three level confirmation is waiting for three indicators to all indicate that the price is heading in a particular direction before enterng the trade.
This form of trading requires that the trader be patient and be disciplined as it is not all the time that three indicators would be giving the same siganls .
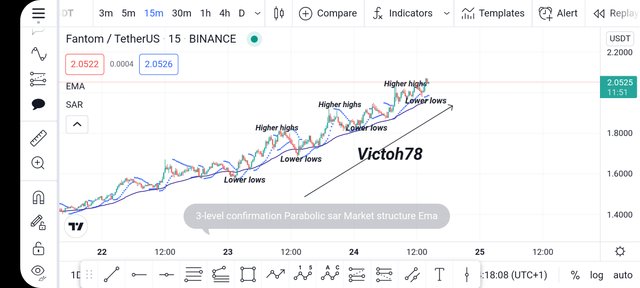
fanthom/tetherUS// trading view
From the chart above we can see a clear illustration of a 3 level confirmation.
The following can be seen on the chart.
market structure
looking at the chart above we can see that the market is trending up making higher highs and lowers lows. This serves as the first signal indicating that we should be looking for buying opportunities in this market.Parabolic sar
Looking at the chart above we can see close to 4 dots under the price which indicates that the price is going up. One dot might be a fake out, but the presence of 2 and above gives confirmation that the price is going up .
This would serve as our second signal that price is going up.21EMA
Lastly from the chart above we can see that the price is above the 21ema which indicates that price is going up.
This serves as our third signal that price is going up.
Summary
Having seen the presence of three indicators all signaling that price is going up. This is what is known as 3-level confirmation and it gives the trader added confidence in his trade, in the case above buying position.
(4)Analyze and Open a demo trade on two crypto asset pairs using confluence trading. The following are expected in this question.
a) Identify the trend.
b) Explain the strategies/trading tools for your confluence.
c) What are the different signals observed on the chart
answer
In this question we are asked to anaylse and execute two trades on any crypto pair of your choice.
first anaylses Shib/usdt 3-level confirmation
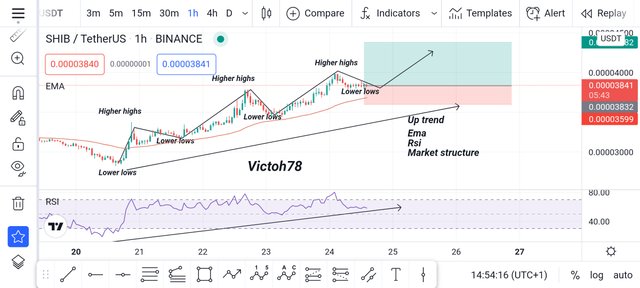
usdt/shib//trading view
Looking at the chart above we can see that the market is in an uptrend.
In order to trade this market using confluence technique just knowing that it was in an uptrend wasn't enough for me, I needed to add order indicators to also confirm this.
3-level confirmation
market structure
As highlighted on the chart above I could see the price making higher highs and lowers lows, this is an indication that the price is in an uptrend.21EMA
From the chart abovee i observed that the price was above the ema, that is also a bullish signals indicating that the price is going up.RSI
With the aid of the trend line which was drawn below the RSI I observed the rsi also going up indicating price rising.
Looking at RSI alone it is not above 70 nor below 30, so ordinarily i would be conflicted about what to do in this situation, but with the help of the other two indicators I am able to ascertain that there is more buying pressure in this market than selling pressure.
summary
Having noted that the three signals are all indicating that the price is going to go up in the near future and that the uptrend is still valid I went into this trade on a demo account and this was the result.
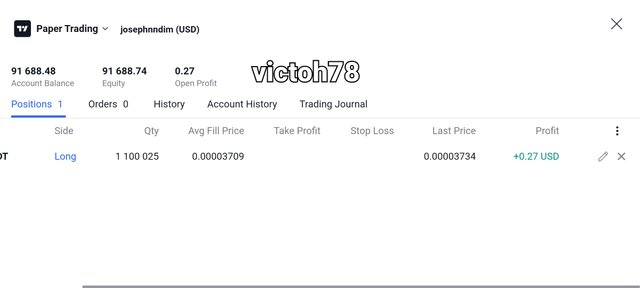
trading view
So far this is the outcome of the trade the trade hasn't hit take profit yet this is just a screenshot evidence of how the trade is progressing.
second anaylses Porto/usdt 3-level confirmation
Porto token this is a fan based token for the football club Porto and from previous anaylses conducted by my self I noticed that the price of this coin goes up considerably whenever they are about to play any
match but mainly high stake match like Europa league.
When they aren't expected to play match in the coming days the price would range.
Without further wasting time the analyses
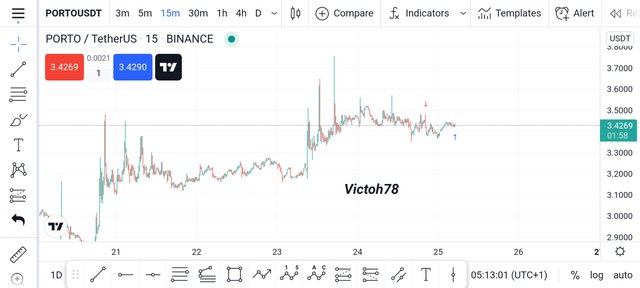
porto/usdt// trading view
Looking at the chart above it is not clear as to the direction the price is going to, since I couldn't easily Identify the direction of trend with my eyes the use of some indicators were necessary.
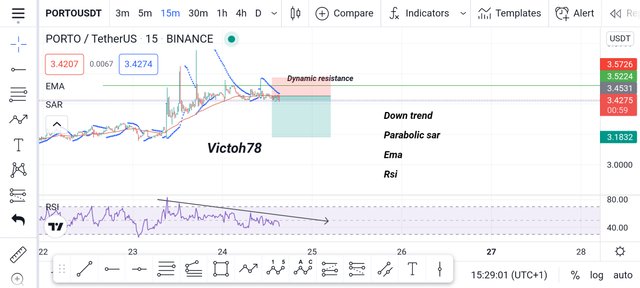
porto/usdt//trading view
From the chart above the nessecary indicators have been added and I can got a better understanding of what is going on.
21EMA
From the 21ema we can see that price is below the 21ema which now serves as a dynamic resistance point the price has not been able to break above the 21 ema hence the trend of the market is going down.
Rsi
Placing the RSI on the chart I observed that the rsi has been downward sloping indicating that the price is falling and the trend is a downward trend. I observed that the RSI started to falled way before the price crossed below the 21ema hence we can say the RSI gave the earliest hint of trend reversal.
This situation is known as RSI divergence and it occurs when the RSI is trending in a different direction from the price, it is a very strong trend reversal signal.
Parabolic sar
From the charts above I observed the dots on the parabolic sar were above the price indicating that the price is on a down trend and I should sell.
summary
Having observed that all the signals were indicating that the price was going down and that the trend reversal is very likely I went ahead to place a sell order on my trade and this was the outcome.
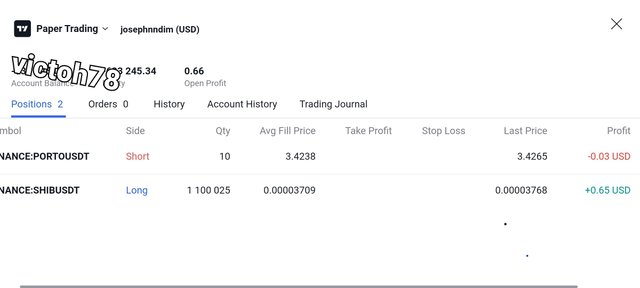
trading view
So far the trade has been ranging agoing in and out of profit presently is it loss but having done the necessary anaylses I am confident that the price would move in the sell direction.
_All screenshots are taken on my device _
Conclusion
From the post above we can see how important the confluence technique is in trading and how it can help imporve traders.
The ability of a trader to combine multiple trading technique to get a better entry time into a trade is very essential as this could mean the difference between a good trader and a trader.
I have answered all the questions presented to me and I strong hope you would find my answered to your taste.
Thank you Prof for this excellent lecture and I look forward to the next