Steemit Crypto Academy Season 3- Dynamic Beginner Course - Week 3 | All about Trends, Supports and Resistances and simple chart patterns. by vibrant6689 for professor @lenonmc21.


Q(1) DEFINE IN YOUR OWN WORDS, WHAT IS A "TREND" AND "TRENDLINES" AND WHAT IS THEIR ROLE IN CHARTS?
TREND
Literally, trend means, a particular dimension, side or direction that something is moving or changing towards.
There are diverse life occurances in which trend can be seen, for example, pop culture, fashion, and entertainment. Also, trend can be seen in the stock market to be bullish or bearish, with respect to economic indicators, or a nation’s current mood which is been reflected by a political trend. Some Trends are fabulous, Some are fun, some awful, but no matter how long they last, you can be certain there will always be a novel trend.
However, in the market world, trend can be explained as the overall direction of an asset or a market price.
Technical analysis is a very strong tool which can be used to locate trends via the trendlines or action of price which hints on when the price is undergoing higher swing highs & higher swing lows in an uptrend, or observing lower swing lows & lower swing highs in downtrend.
Several traders chose to trade in the same direction as a trend, while some who are of contrary view seek to take note of reversals or trade that is against the trend.
It's good to note that uptrends and downtrends takes place in all markets, like bonds, stocks, and futures. Trends can also occur in information, for example, when monthly economic information falls or rises from month to month.
ROLE OF TRENDS IN A CHART
Traders are able to identify a trend using diverse kinds of technical analysis, like trendlines, price action, & technical indicators. Take for instance, relative strength index (RSI) is structured to display the capacity of a trend where as the trendlines displays direction of a trend at any given time.
Uptrend
This is marked by a total increase in price.
There is no how something will move straight up for a very long time, there will always be a regular periodic fluctuations, but the total direction have to be higher before it can be considered to be an uptrend. Recent swing highs should be above prior swing highs, and the same goes for swing lows.
Once this arrangement starts to disorganise, the uptrend is likely to be losing steam or making a reverse into a downtrend. Charistics of trends includes lower swing highs
and lower swing lows.
While the trend is still up, traders may have the believe it will continue that way until there is evidence that points to the opposite. This evidence includes the following...
(1) The price breaking below a trendline,
(2) Lower swing highs or lows, or
(3)T echnical indicators turning bearish.
As the trend is still up, the traders buy more into the market so that they can make profit from a progressive price rise.
In the other hands, the traders now focuses majorly on shorting or selling with the aim of reducing losses or gain from the price fall when the trend starts going down.
Most downtrends do reverse at some point, not all though, so that, as the price continues to fall, more traders start to see the price as a bargain, and as result steps in to buy. This could most likely lead to the reappearance of an uptrend again.
Trends can also be useful by traders focused on fundamental analysis. This kind of analysis considers the changes in earnings, revenue, or other business. For instance, the fundamental analysts may consider trends in earnings per share & revenue growth. Thus, If earnings have gone up for the past four quarters, it signifies a positive trend. However, if earnings have gone down for the past four quarters, it signifies a negative trend.
The Trendless period
There are times when you will be studying the price direction with your chart, you will find out that the market is either bullish nor bearish but is more like stable at the center.
This occurrence is called trendless period.
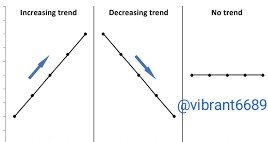
Above is a discribtive image showing 3 different trends.
The last third one by the right hand side is a typical example of lack of trend.
TRENDLINES
These are parallel lines which have been familiarized by traders. Traders draw this lines on charts to display few informations best matched or to link a chain of prices together . The investor makes use of this resulting line to study the direction in which the value of an investment might move.
These lines are used in tracing the market behavior, they are drawn under either the pivot lows or highs, so that it can be of use in determining the price direction. Trendlines are visual representation of resistance and support in any time frame. They show speed and direction of price, and also explain patterns during time of price contraction.
ROLE OF TRENDLINES IN CHART
Trendline is one of the most important instruments used by technical analysts. Rather than considering past business behavior or other fundamentals, A technical analysts would rather focus on the trends in price action.
The trendline assist a technical analyst to determine the present direction in market prices. Technical analysts have the believe that the trend is your friend, and as such, identifying this trend is the initial step if you want to make a good trade.
In other to develope a trendline, the analyst ought to have not less than two points on a price chart. Some analysts prefer to use diverse time frames like, one minute or five minutes. But others pay more attention the daily charts or weekly charts.
Then, another sets of analysts do not use time at all, but choose to view trends based on tick spacing rather than spacing of time. The reason that makes trendlines to be universally accepted and usage is because they can be very useful in identifying trends even without considering the time frame.
While trendlines do a very nice job of showing total direction, they will frequently need to be redrawn. Take For instance, if there is an emergence of uptrend, dropping of the price below the trendline is most likely. However, this incidence necessarily imply that the trend is over. The price may go down below the trendline and continue rising. When this kind of incident occurs, it is necessary to redraw the trend line to the trendline may need to be redrawn to mirror a new price action.
Q(2) EXPLAIN HOW TO DRAW AN UPTREND LINE AND DOWNTREND LINE (show screenshots of each)
There are several things you need to consider when drawing trendlines.....
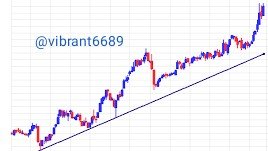
When you want to draw a downtrend line, you draw them above the price
While you draw an uptrend line below the price.
what you also look out for are the lows on the uptrend and the highs on the downtrend.
These are useful parameters that determine a trendline.
Thus, not less than two swing lows or swing highs are required to draw a trend line in any of the directionsHowever, before a trend line can be more relevant, not less than three lows or highs should be used.
More importantly, as often times as the price touches a trend line, that is the more relevant it is. The reason is because there are many traders who are using them as resistance or support.
The image above is a screenshot showing the both trendlines.
The first one by the left hand side is showing 3 swing highs on the downtrend while the second by the right hand shows shows 3 swing lows on the uptrend.
WICKS OR BODIES OF THE CANDLE
From my research, I discovered that the pattern or method used in drawing trendlines differs, and it's dependent on what works for and what a trader could understand better.
In that regards, alot of traders makes use of the wicks of candlestick to draw their trendlines. while some makes use of the candlestick bodies But still, even though majority of traders makes use of the wick, the acceptable way still remains the use of the bodies.

source
Image above is a chart that shows the use of wicks of the candle stick to draw trendlines
While the one below shows the use of the body of candle stick to draw trendlines.

Q(3)DEFINE IN YOUR OWN WORDS WHAT"WHAT SUPPORTS AND RESISTANCE ARE
AND HOW WE CAN IDENTIFY BOTH ZONES(show screenshots of each one)
SUPPORT
This is a price stage where a temporal stop or a halt is expected in the downtrend which is as a result of buying interest or demand concentration.
The support line is formed following a drop of assets or securities.

source
Support line
RESISTANCE
Resistance is the reverse of a support.
It is a stage where the price tends to build immunity as it rises.
This implies that there is a tendency of the price to bounce off this level instead of breaking through it.
However, as soon as the price has broken this level, by an amount in an excess of some noise, there is a tendency that it will continue to rise until it meets another resistance level.

source
Resistance line
Note For a resistance or support level to be important, the price have to touch the level for atleast, three times.
HOW TO IDENTIFY RESISTANCE AND SUPPORT ZONE IN A CHART
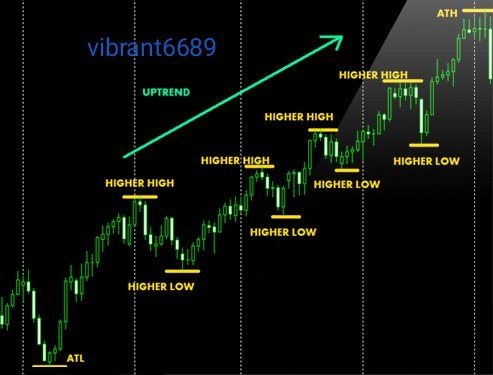
Once you access the chart in the time interval which you will be trading, take note of the highest culminate in the chart, then, mark it as the All Time High "ATH". Next is to find the lowest base and also mark it, but this time, as the All Time Low "ATL"

For instance, the image above is a chart that shows that prices are in the down trend. You will mark short horizontal lines on each of the culminate and base. Then in the downtrend, the lower high will become the resistance level and the lower low becomes the support level.
But we have the opposite in the image below which is an uptrend. All higher culminate will become the resistance level and all higher base will become the support level. See image...
Q(4)EXPLAIN IN YOUR OWN WORDS ATLEAST, TWO SIMPLE CHART PATTERNS WITH SCREENSHOTS
DOUBLE TOP CHART
This is a regular price behavior at the termination of a market in the bullish trend. It explains the features of a market chart having two consecutive culminate which are almost same price on a price against time chart of a market. Price minimal is what that divides the two culminate. Looks just like valley.
The price at thesame height of this minimal of the formation is known as the neck line. Anytime the price drops below the neck line, with an indication that further price fall is impending or inevitable, Then the formation is confirmed and completed.
The information the double top chart is trying to communicate is that the buyers are predominant upto to the first top and as a result, has more demand than supply leading to a rise in price.
The supply - demand stabilizes, then make a reverses:
This times, sellers becomes predominant with supply weighing morethan demand, thus, causing a fall in price.
However, buyers would predominate again with price inflation after a price valley. Then If traders observe that prices are not breaking past their level at the initial top, sellers may likely prevail again deflating the prices, hence, leading to a formation of double top.

source
example of double top chart

Source
Image showing trend and trendline
DOUBLE BOTTOM CHART
The double bottom is the final formation in a falling market. It looks just like the double top but differs on the inverse price relationship.
The double bottom is formed by two price minimal divided by local culminate around the neck line. Thus, when the price pushes above the neck line, with an indication that further price increase is impending or inevitable, then the formation is completed and confirmed.

Both the double top and double bottom chart shares most equall, most of the rules.
The prices should be flat at the second bottom, while the volume will display a marked rise on the rally up.
CONCLUSION
It was indeed an effective and imparting class with an erudite professor @lenonmc21
I got a very quality knowledge and understanding on the fundamentals of charts analysis and interpretation.
- Say, how to identify and draw either of the trendlines
- Use of the body or the wick of the candle stick to draw either of the support or resistance line.
Then, one significant thing I noticed is that thesame lines which are used as trendlines, downtrend and uptrend still serve as resistance or support lines.
Regards to professor..
@lenonmc21
hello, you are part of the 500sp healing support, but remember to post in the steemit nursery community and always put your achievement 1 in the post. so you can keep increasing your steempower.
Thanks for the infor @graceleon🙏